Niblin
BUDGETING AND FORECASTING FOR CONSUMER BRANDS

FP&A for consumer brands with a lean finance team.

Plan, forecast and explain every channel and SKU, on numbers that sync every morning.

Book a demo See the platform
● No consultant needed● Native integrations● Syncs daily
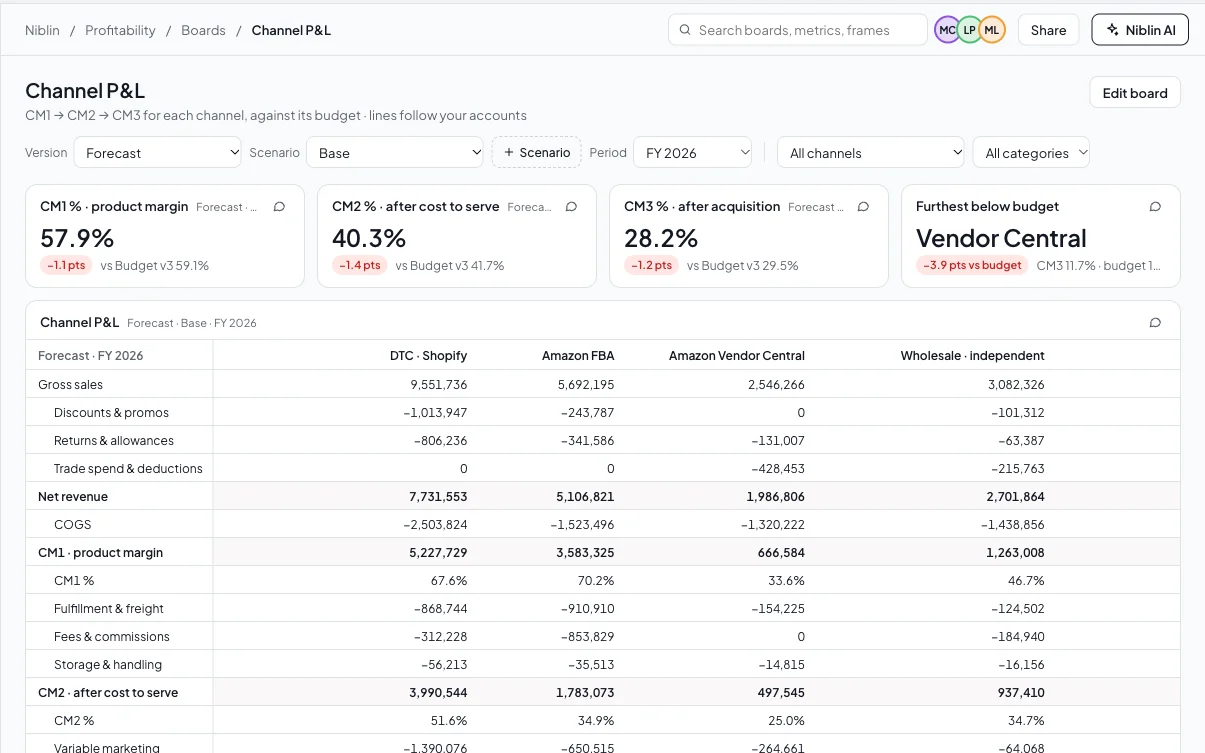
Where every $100 of gross sales goes FY26 forecast · by channel Synced today 06:00
Discounts, returns, trade COGS Fulfillment, fees, storage Marketing CM3 kept
DTC · Shopify
$27
33.6% −2.0 pts
Amazon FBA
$20
22.2% −0.8 pts
Vendor Central
$9
11.7% −3.9 pts
Wholesale
$28
32.3% −0.1 pts
National retail
$27
30.8% −0.1 pts
Bar end: CM3 as % of net revenue, vs budget. Sample brand.
NIBLIN FLAGGED
COST TO SERVE Amazon FBA spends $32 of every $100 on fees, fulfillment and storage.
BELOW BUDGET Vendor Central keeps $9 of every $100. CM3 is 3.9 pts under budget.
MIX Wholesale keeps $28 of every $100, more than DTC once marketing is counted.
SYNCS DAILY WITH
XeroQuickBooksZoho BooksShopifyAmazon Seller CentralVendor CentralTargetSPS CommerceShipBobMeta Ads

Keep your process and your spreadsheets. Lose the manual work.

TODAY Actuals exported by hand from every portalBudget templates emailed out and merged backOne person who knows how the files link
WITH NIBLIN Actuals synced from books and channels every morningDepartment heads plan in Niblin, on your templatesApprovals, versions and audit trail kept for you
THE PLATFORM

The full FP&A stack, rebuilt for consumer brands.

PLAN
Budgeting Top-down and bottom-up, approved
Workforce planning HR system plus hiring plan
Capex planning Projects vs POs and spend
FORECAST
Driver-based forecasting Units × price, channel × SKU
Scenario planning Price, freight, channel mix
Linked financial model P&L, cash flow, 13-week cash
Revenue planning Gross to net, not ARR
EXPLAIN
Variance analysis Price, volume, mix, down to CM3
Reporting Board packs, emailed on schedule
Niblin AI Exact answers, working shown
CONTROL
Data integration Books and every channel, daily
Workflow and controls Approvals, locks, audit log
PLAN

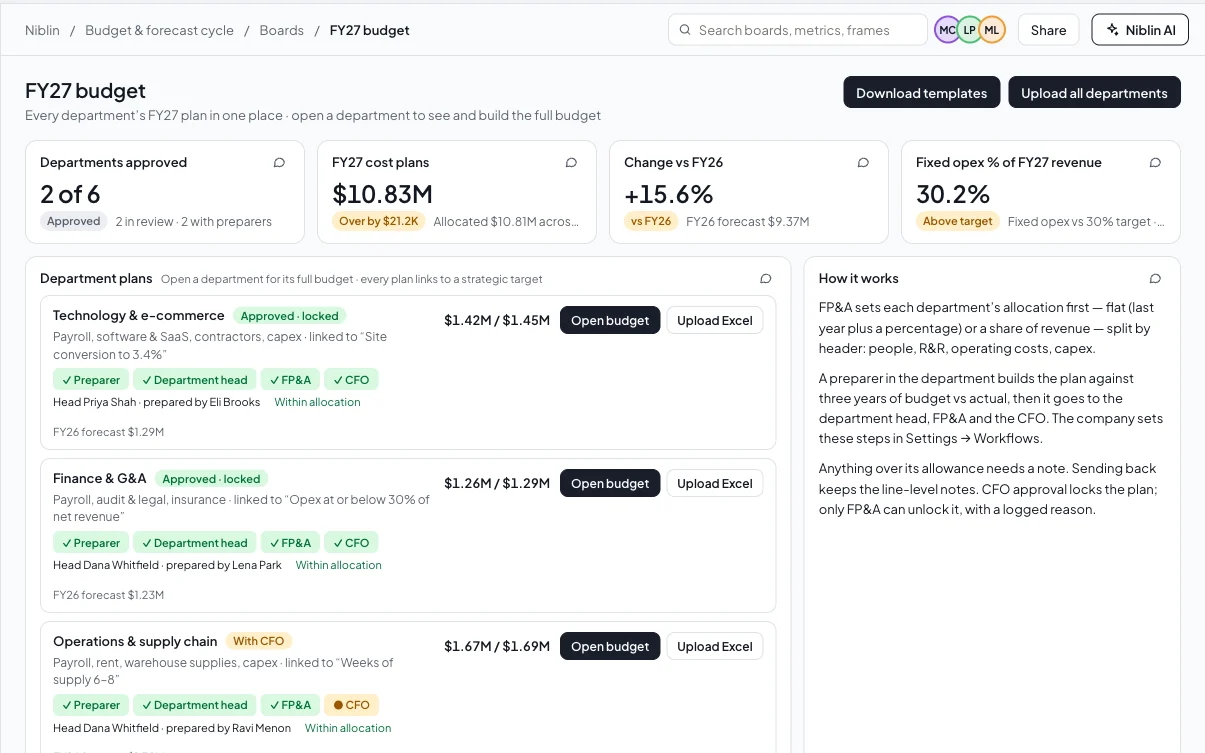
Budgets the whole company builds. Approved once.

Top-down allocations, bottom-up department plans tied to targets, and your approval chain from preparer to CFO.

FY27 budget 2 of 6 departments approved PREPARER · HEAD · FP&A · CFO
Technology & e-commerce Target · Site conversion to 3.4%
APPROVED
Finance & G&A Target · Opex at or below 30% of net revenue
APPROVED
Operations & supply chain Target · Weeks of supply 6–8
WITH CFO
Marketing & brand Target · 4× return on marketing spend
WITH FP&A
Sales · retail & wholesale Target · Two new national retail accounts
SENT BACK
Product & design Target · Six launches with 60% CM1
DRAFTING
SENT BACK Sales: trade show travel is up 50% with no new accounts in the plan.
WORKFORCE
37 → 43 → 48
Headcount Jan 1, today, and forecast at Dec 31. Payroll flows into opex and cash.
CAPEX $511.5K / $740K
Spent vs approved. Forecast at completion $757.5K.
FORECAST

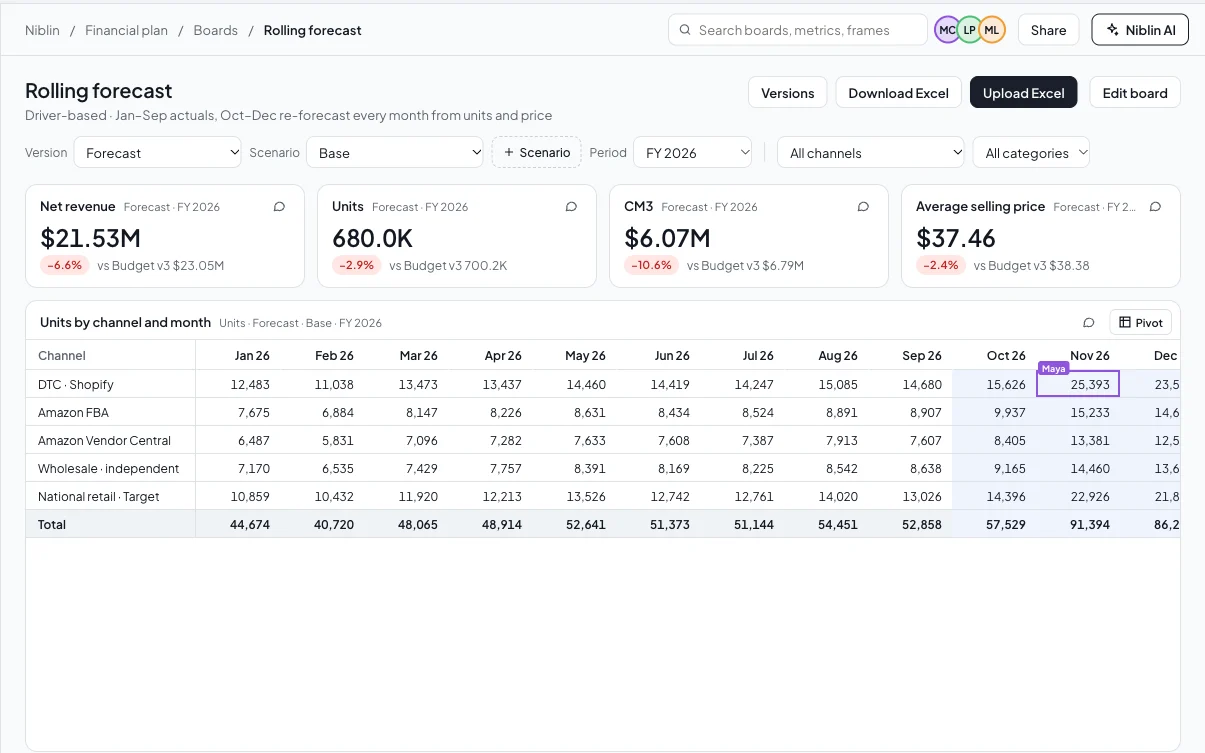
Forecast from units and price. Test any decision first.

Driver-based by channel and SKU, with discount, returns, trade, fee and storage rates from your own data. Run a scenario and the P&L and cash follow.

Scenario
FY26 net revenue$21.53Mvs base · no change
FY26 CM3$6.07Mvs base · no change
CM3 % of net revenue28.2%vs base · no change
READCurrent forecast: units × price by channel and SKU, with rates from your own data.
Units × price→Gross to net→CM1 · CM2 · CM3→P&L · cash flow · 13-week cash
FY26 CM3 by scenario
Base$6.07M
Price +10%$6.27M
Freight and COGS shock$5.70M
Shift spend to DTC$6.06M
Sample brand. Price scenario uses your own elasticity.
EXPLAIN

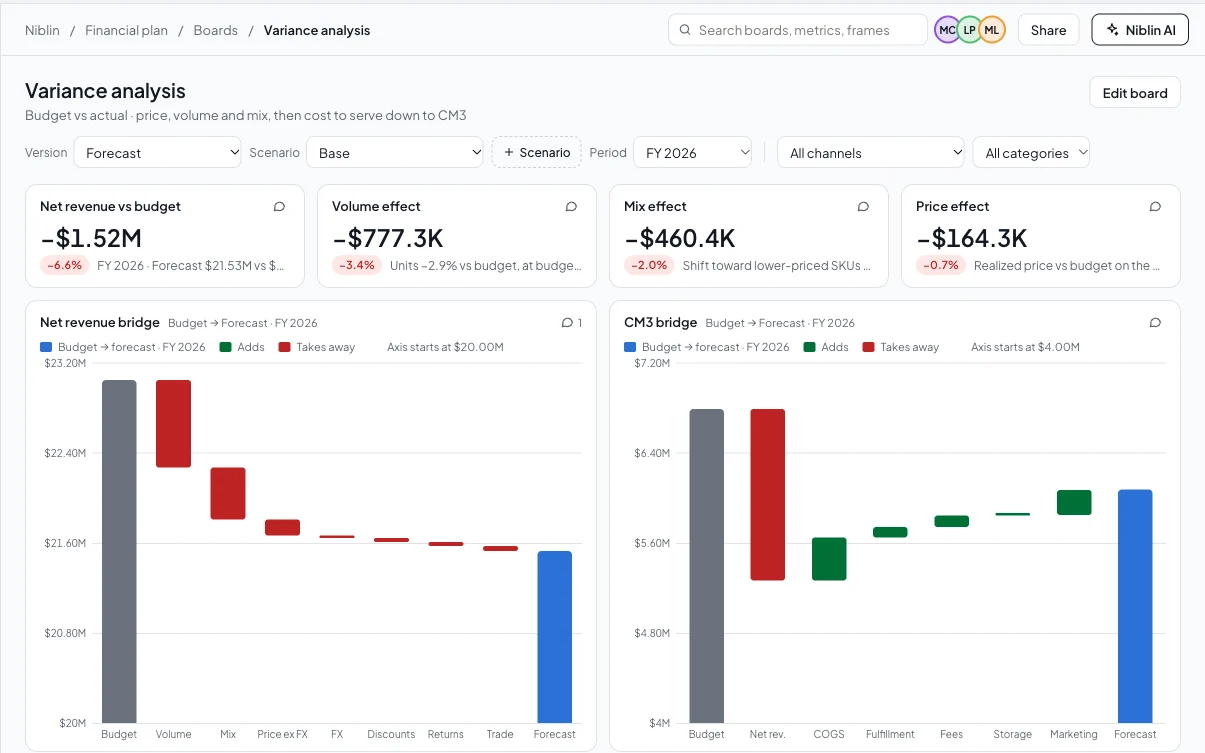
Every variance explained, down to CM3.

Budget to actual, bridged through net revenue and every cost layer, and traced to the orders and bills behind it.

CM3 bridge · YTD actual vs budget −$473.1K
$4.44M
Budget CM3
−$973.1K
Net revenue
+$229.8K
COGS
+$66.5K
Fulfillment & storage
+$64.4K
Fees
+$139.3K
Marketing
$3.96M
Actual CM3
Net revenue gap: Volume −$457.7KMix −$299.8KPrice −$108.0KDiscounts, returns, trade −$107.6K
WHAT HAPPENED YTD CM3 is $473.1K behind budget.
WHY Lower volume and an adverse mix cut net revenue by $973K. Lower COGS and marketing recovered $500K.
WHAT NEXT Reset Q4 units for Growth SKUs in the rolling forecast.
REPORTS, EMAILED ON SCHEDULE
Management packBudget vs actualChannel reviewProfitabilityForecast changes
NIBLIN AI

Ask in plain English. Get the exact number.

Deterministic answers from the same model behind every board, with the working shown and access respected.

Why is CM3 behind budget?

−$473.1K. Volume and mix cut net revenue by $973K; lower COGS and marketing recovered $500K.

Sources · Xero, Shopify, AmazonMethod · YTD vs Budget v3 bridge
CONTROL

Governed planning, on numbers that sync daily.

Not a model one analyst maintains. A plan the whole company works in, with the controls a CFO expects.

Data sourcesRead-only
Xero, QuickBooks or Zoho BooksGL, chart of accounts, bills, POs ● 06:00
Shopify + Shopify PaymentsOrders, discounts, returns, payouts ● 06:00
Amazon Seller and Vendor CentralSettlements, fees, storage, shortage claims ● 06:00
Target and SPS Commerce EDIRetail orders, chargebacks, deductions ● 06:00
ShipBob and ad platformsFulfillment, freight, spend by channel ● 06:00
Your HR systemHeadcount, departments, reporting lines ● 06:00
Your approval chainSteps, roles and thresholds you define.
Locked means lockedChanges after approval need a logged reason.
No self-approvalApprovers send back with notes, not edits.
Access follows your org chartIncluding reports, exports and Niblin AI.
Every version keptCompare or restore any save or Excel upload.
Full audit logWho changed which number, when and why.

See the product.

FY27 budget board in Niblin Rolling forecast Variance bridge Channel P&L
CONSUMER BRANDS ALREADY USING NIBLINViolet DeerNutraEdgeAlaiHoyiCoreNovoHighDrateIndia Shirt House
NutraEdge
“We were about to hire a data analyst. Then we tried Niblin.”
Atik · CMO, NutraEdge
Hoyi
“We asked “which customers are about to churn?” and got 152 names with dollar amounts at stake and a win-back plan.”
Dhruv · Founder, Hoyi
NutraEdge
“The discount dependency analysis alone found that our best promo code was destroying LTV.”
Atik · CMO, NutraEdge
BUILT BY A team from IIT Kanpur and IIM Ahmedabad, with over a decade in financial services and consumer brands.

Set up jointly, around how your team already works.

NO CODER · NO CONSULTANT
  1. 01 Connect, read-only Books, stores, marketplaces, 3PL and HR system.
  2. 02 Map your books Chart of accounts, segments and channels, together.
  3. 03 Bring your templates Your Excel budgets and up to three years of history.
  4. 04 Set your approval chain Your steps and roles. Then invite the team.

See where your brand actually makes money.

A walkthrough built around your channels. For consumer brands selling on two or more channels, on Xero, QuickBooks or Zoho Books.