
 By
"Yes, 3+9 means 3 months actuals 9 month budget/forecast. Typically, budget is built and leaned upon heavily the first portion of the year. Forecast comes into play once trends are realized. Basically, the forecast is an adjusted budget with new information."
— Source: r/FPandA (35 upvotes)
Every finance team talks about the budget, the forecast, and the plan. Yet many people use the terms interchangeably, and processes often blur the boundaries.
This creates confusion in meetings: "Are we reporting against the budget or the forecast?" "Do we update the plan quarterly?" "What does 3+9 mean?" And it muddies accountability: should we explain why we missed the budget, or the forecast, or both?
The truth is simple: budget, forecast, and plan are three separate tools, each built at a different time, for a different purpose, with different governance. Understanding which is which, and when to use each, is foundational to running an FP&A function that actually informs business decisions.
Budget vs Forecast vs Plan: Definitions
What is a Plan?
Plan is a long-range vision of the business, typically 3 to 5 years out. It answers: "Where does the business intend to go?" It includes revenue targets, major initiatives, headcount growth, and investment decisions.
A plan is strategic. It's agreed upon by the board and leadership, and it changes infrequently (once per year, or when major pivots occur). Example: "We plan to grow revenue from $10M to $50M in 5 years, add 3 new channels, and build an internal logistics team."
The plan sits in the background. It guides where the budget and forecast should land, but it's not a detailed operating document. It's the north star.
What is a Budget?
Budget is a detailed, one-year financial plan that sets expectations before the year begins. It translates the strategic plan into monthly targets for revenue, headcount, expenses, cash, and capital. It is fixed throughout the year (or very rarely updated).
The budget is the primary tool for allocation, accountability, and governance. Leadership commits to it. Managers' bonuses are tied to it. The board approves it. During the year, performance is measured against the budget.
Because the budget is built before the year starts (typically September through November for the following year), the assumptions baked in are based on last year's actuals and management's best guesses. Once January arrives, those assumptions may no longer be true.
What is a Forecast?
Forecast is an updated projection of the year's financial results, built periodically (monthly, quarterly) with real actuals and new information. It replaces prior assumptions with current data and revised trends.
The forecast is a rolling document. As actuals come in, the forecast is recalculated to reflect what you now believe will happen for the full year. It mixes actual results (to date) with projected results (forward).
Example: in March, you have 3 months of actuals (January-March) plus 9 months of projections (April-December). This is called a "3+9" forecast. In April, you have 4 actuals plus 8 months of projections, called "4+8". And so on.
The forecast is the forward-looking truth. As leadership, if you want to know what the year will actually deliver (given today's market, actuals, and trends), the forecast tells you. The budget tells you what was hoped at the start of the year.
The Key Differences
| Dimension | Plan | Budget | Forecast |
|---|---|---|---|
| Time horizon | 3-5 years | 1 year | Next 9-12 months |
| Built when | Annually (or during strategy refresh) | Sep-Nov, before year starts | Monthly or quarterly |
| Based on | Strategic vision and assumptions | Last year + plan + targets | Actual results + new trends |
| How often updated | Rarely (1-2x per year) | Never (fixed through year) | Monthly or quarterly |
| Primary use | Strategic alignment | Accountability and bonuses | Decision-making and course correction |
| Owner | CEO and board | Finance, shared with ops | Finance and business partners |
| Accuracy needed | Directional | Hit it (tied to comp) | As accurate as possible |
| Example | "Grow to $100M revenue in 5 years" | "2025 target: $20M revenue, 50 headcount" | "We will land at $19.5M revenue; headcount will be 48" |
The plan sets direction. The budget sets targets and accountability. The forecast tells you the truth.
When to Use Each One
Use the Plan for
- Board and investor meetings: "Here's our 5-year vision."
- M&A and fundraising: "This is where we're headed."
- Major investment decisions: "Do we have the 5-year revenue to justify building new infrastructure?"
- Hiring strategy: "Based on the plan, how much headcount do we need in year 2-3?"
- Product roadmap: "What products or channels does the plan assume we'll launch?"
Use the Budget for
- Annual target-setting: "Sales team, your 2025 revenue goal is $15M."
- Resource allocation: "We've budgeted $2M for marketing. Here's how it's allocated by channel."
- Compensation and bonuses: "You'll earn a bonus if we hit our budgeted profit target."
- Monthly variance analysis: "We budgeted $X for OpEx. We spent $Y. Here's why."
- Expense control: "Did you stay under your departmental budget?"
Use the Forecast for
- In-year decision-making: "Is revenue tracking above or below budget? Do we need to cut costs?"
- Scenario planning: "If this trend continues, what will Q4 look like?"
- Cash management: "Will we have enough cash to fund this new initiative?"
- Early warning: "Our forecast is 10% below budget. We have 6 months to course-correct."
- Board updates: "Here's our updated view of full-year results."
In a well-run FP&A function, you report three numbers to leadership: actual (what happened), budget (what we committed to), and forecast (what will happen by year end). All three are important. The variance between budget and actual shows if your original assumptions were sound. The variance between forecast and actual shows if your current trends are changing.
Rolling Forecasts and Reforecasting
A rolling forecast is a forecast that is constantly updated. As actual months are completed, they drop into the model, and the forward-looking months roll forward.
Example: January 1, you forecast all 12 months of 2025 as "1+11" (1 month actual, 11 months projected). January closes. February 1, you update to "2+10" (2 months actual, 10 months projected). March closes, you forecast "3+9". And so on.
Why rolling forecasts work better than static forecasts
- They absorb new information: As actuals come in, you can see if trends are shifting. Q1 was strong? Update Q2-4 expectations. Q1 was weak? Flag issues early.
- They stay relevant: A forecast built in September is stale by February. Rolling forecasts stay current.
- They improve accuracy: As you accumulate actual data, the remaining 9 months of projections become more informed and more likely to be correct.
- They enable course correction: If the forecast shows you'll miss profit targets, you have 6-9 months to cut costs or accelerate revenue. A static budget doesn't tell you this until December.
How often should you reforecast?
Monthly is the industry standard for most companies. Every month, after actuals close, you rebuild the forecast. For fast-moving businesses (SaaS, e-commerce, venture-backed), monthly is essential. For stable, slower-moving businesses (manufacturing, utilities), quarterly may be enough.
Some companies do weekly "flashes" for a quick pulse, but these are not full reforecasts. A flash is a high-level check: "Are we on track for the month/quarter?" The full reforecast (with detailed build and variance analysis) is monthly.
One Reddit FP&A professional notes: "Rolling forecasts make the most sense. The shit you guessed back in November last year is garbage by February. Good companies reforecast quarterly; bad companies explain crazy variances every month."
The key insight: reforecasting is not replacing the budget. The budget stays the same (for accountability). The forecast is built separately to show what you now believe will happen.
A Practical Example: 3+9 Forecasting
Illustrative example: a $15M consumer brand at March close
A brand selling DTC, on Amazon and to retailers closes March books in early April. All figures are example assumptions:
- Actuals (Jan-Mar): $1.00M (Jan), $0.95M (Feb), $1.05M (Mar). Total: $3.00M.
- Forecast (Apr-Dec): built from channel drivers and seasonality, the team projects $11.70M for the rest of the year, with Q4 carrying the heaviest months.
- Full-year forecast: $3.00M actual + $11.70M projected = $14.70M.
- Original budget: $15.00M (approved in November).
- Variance: the forecast is $300K below budget, a 2.0% miss.
The team traces the gap to one cause: a retail partner pushed its shelf reset from April to June, so two months of sell-in moved later in the year rather than disappearing. They tell the board: "Budget was $15.0M. We forecast $14.7M (98%). The gap is timing at one retailer, not demand."
If the forecast had come in at $13.0M, about 13% below budget, the conversation would be different: that points to a demand or conversion problem, and the team would move straight to cost and inventory decisions.
That is the job of a rolling forecast: monthly visibility into whether the year is on track, and how much time is left to fix it.
Understanding the 3+9 notation
The "3+9" notation is standard in FP&A. It means:
- 3: Three months of actuals (January, February, March) - real, recorded results
- 9: Nine months of forecast (April through December) - projected, based on current trends
As months progress, the numbers shift:
- May close: 5+7 forecast (5 actual months Jan-May, 7 projected months Jun-Dec)
- August close: 8+4 forecast (8 actual months, 4 projected)
- December close: 12+0 (full year actuals, no projection needed)
The cumulative effect: as you accumulate actuals, your projections become more accurate. In January, you're guessing at 11 months. By August, you're guessing at only 4 months. This is why mid-year forecasts are much more reliable than beginning-of-year budgets.
Building an Effective FP&A Process with Plan, Budget, and Forecast
The annual cadence
| Period | Activity | Owner | Output |
|---|---|---|---|
| Jul-Aug | Refresh strategic plan | CEO, Board, Finance | 3-5 year plan, updated revenue/profit targets |
| Sep-Nov | Build annual budget | Finance, all departments | Detailed 2025 budget by department, month, and cost center |
| Late Nov | Board approval | Board | Budget approved and locked |
| Jan 1 | Publish budget | Finance | Budget is the baseline. Bonuses tied to it. |
| Jan 31 | Close actuals, build first forecast | Finance | January actuals locked. 1+11 forecast published. |
| Monthly | Close and reforecast | Finance, Business partners | Monthly forecast (2+10, 3+9, etc.) published within 5 business days of close |
| Quarterly | Board or investor updates | CFO | Actual vs budget, actual vs forecast, variance narrative |
A realistic FP&A workflow
- Monday-Wednesday of close week: Accounting closes the books. FP&A validates and loads actuals.
- Thursday-Friday: FP&A reviews actuals against last month's forecast. Are variances explained? Are trends shifting?
- Next Monday: FP&A updates the forecast model with new assumptions (revised marketing spend, discovered churn, etc.) and publishes.
- Next Tuesday-Wednesday: Finance leads variance meetings. "Actual vs budget: why the miss? Forecast vs actual: are we still on track?"
- By next Friday: Monthly board pack or investor update is ready.
The discipline of this cadence keeps leadership informed and allows for course correction. Without it, you don't know your true position until December.
Notice: budget is published once (January). Forecast is published every month. Variance analysis compares all three: actual vs budget vs forecast.
For Consumer Brands: Budget and Forecast Across Channels
For consumer brands selling across DTC, Amazon, wholesale, and retail, the budget and forecast process is more complex because each channel has different economics, seasonality, and lead times.
Channel-specific budget assumptions
- DTC: paid media plan, CAC, conversion rate, average order value, return rate and payment processing fees.
- Amazon: unit velocity by ASIN, referral fees (15% in many categories; check Amazon's fee schedule for yours), per-unit FBA fees, Amazon ad spend and in-stock rate.
- Wholesale: confirmed purchase orders, retailer reset dates, payment terms (often net 30 to net 60), trade spend and expected deductions.
- Retail sell-through: store count, velocity per store per week and promotional calendar, which drive reorders and therefore future sell-in.
Illustrative example: beauty brand Q1 budget vs forecast by channel
The Q1 budget, with contribution margin after COGS, channel fees, fulfillment and advertising (example assumptions):
| Channel | Q1 budget revenue | Contribution margin | Budget contribution |
|---|---|---|---|
| DTC (Shopify) | $800K | 25% | $200K |
| Amazon | $500K | 15% | $75K |
| Wholesale | $300K | 22% | $66K |
| Total | $1,600K | 21.3% | $341K |
At February close the team has two months of actuals plus one month of forecast (a 2+1 view):
| Channel | Jan-Feb actual | Mar forecast | Q1 forecast | vs budget | Forecast contribution |
|---|---|---|---|---|---|
| DTC | $480K (new SKU launch slipped to mid-March) | $300K | $780K | -$20K | $195K |
| Amazon | $380K (ahead of plan) | $200K | $580K | +$80K | $87K |
| Wholesale | $180K (POs on track) | $120K | $300K | $0 | $66K |
| Total | $1,040K | $620K | $1,660K | +$60K (+3.8%) | $348K (21.0%) |
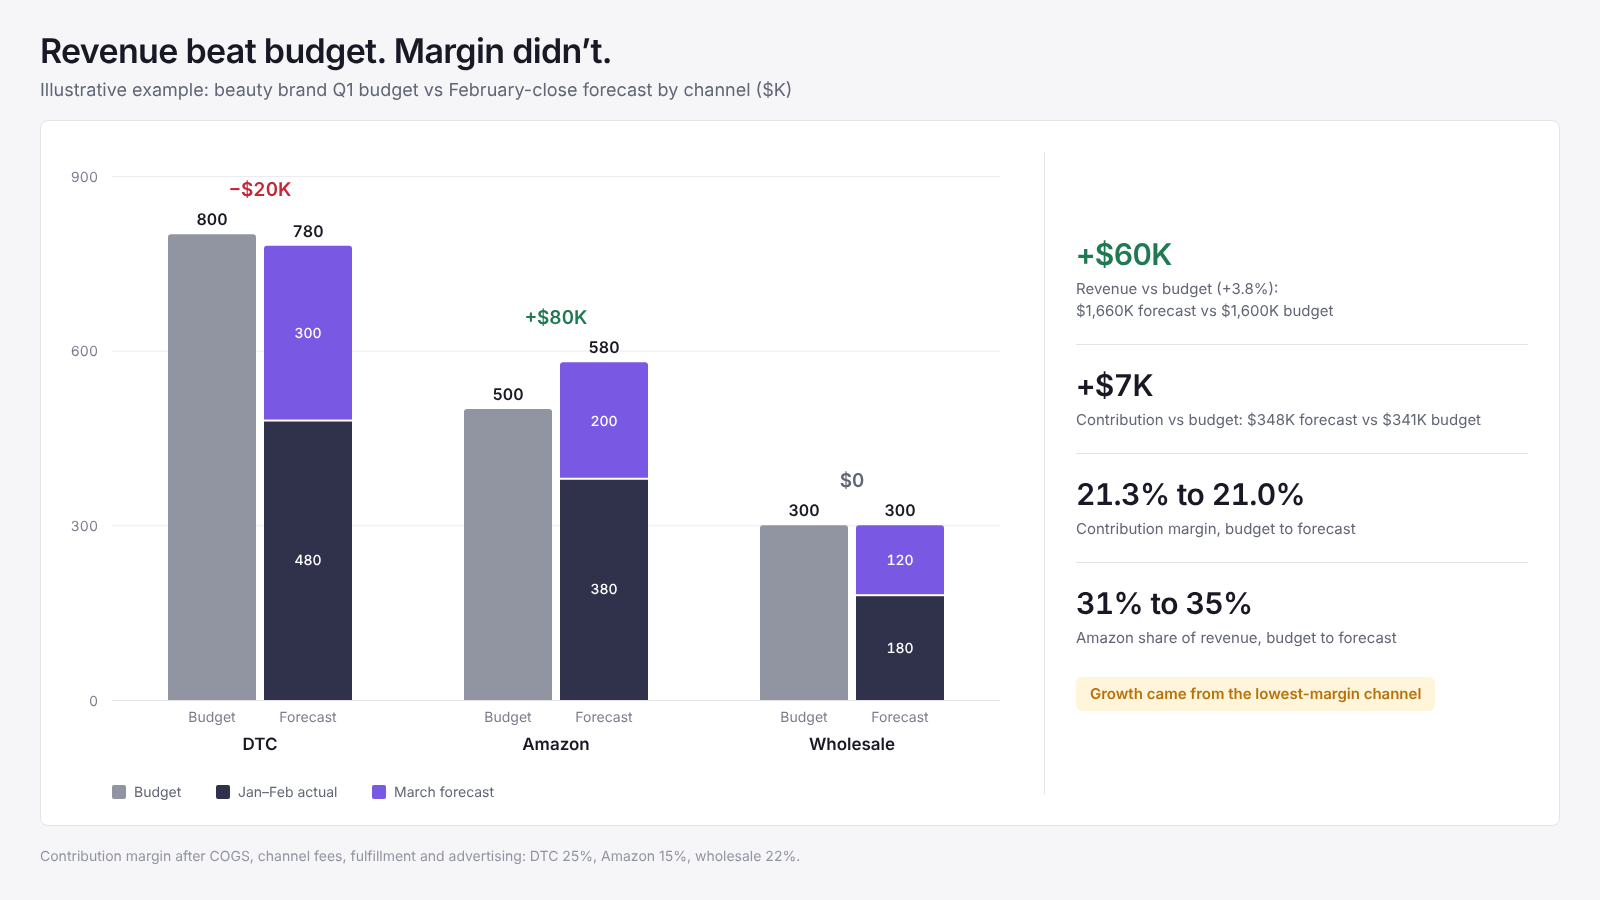
What the forecast shows: revenue is $60K ahead of budget, but contribution is only $7K ahead, because the growth came from Amazon (now 35% of revenue vs 31% in the budget) at a 15% margin while DTC fell short. A revenue-only report would call this a good quarter. The channel forecast shows margin mix getting worse.
Leadership now has a real decision to make in February instead of after March close: put more into DTC acquisition behind the delayed SKU launch, or accept the Amazon-heavy mix and reset the margin expectation for the year.
Rolling forecast updates for channels
When reforecasting monthly, consumer brands must update channel-specific assumptions:
- Did DTC CAC increase or decrease? Adjust the monthly marketing budget and the expected platform ROAS and MER.
- Did Amazon change fees? Recalculate margins immediately.
- Did a retailer reduce shelf space or cancel an order? Lower the wholesale forecast.
- Is a new channel launching? Add a new line with conservative ramp assumptions.
A connected FP&A model ties budget, forecast, and actuals across all channels. When a channel assumption changes, the entire forecast updates with it. If Amazon fees rise two points, you see the margin impact across every month and scenario.
From Static Budget to Living Forecast
Most finance teams build a budget in November, lock it, and compare actuals to it all year. The problem: by March, the budget is stale, and you don't have a forward-looking view of the year.
Best-in-class FP&A functions maintain three documents: the strategic plan (direction), the locked budget (accountability), and a rolling forecast (truth). Each serves a purpose. When leadership asks "Are we on track?", the answer comes from the forecast, not the budget.
For consumer brands, this is more critical than ever. DTC channels move fast. Wholesale orders can be cancelled. Amazon fees change. A static budget misses all of this. A rolling forecast, updated monthly and broken down by channel, tells you the real story.
Stop managing the year against last November's assumptions.
Niblin's rolling forecast automatically incorporates monthly actuals and channel-level changes, so your forecast always reflects current trends. Build your forecast once, update assumptions when things change, and let the model recalculate across all channels and months.
See how Niblin models it
Frequently Asked Questions
What's the difference between a budget and a forecast?
Budget is a fixed, annual financial plan built before the year starts. It sets targets for revenue, expenses, and profit. Forecast is a rolling, monthly projection of full-year results, updated as actuals come in and trends change. Budget is for accountability. Forecast is for decision-making.
Why do we need both a budget and a forecast?
Budget sets expectations and accountability (tied to bonuses and performance reviews). Forecast shows what will actually happen given current trends. Early in the year, they're similar. By midyear, the forecast may diverge sharply from budget, signaling that assumptions were wrong or the business changed.
What does 3+9 mean in forecasting?
A 3+9 forecast means 3 months of actuals and 9 months of projections. If you're in April and have completed January-March, your forecast is "3 actual months plus 9 projected months" for the full year. In May, it becomes 4+8, then 5+7, and so on.
How often should we reforecast?
Monthly is standard for most companies. After actuals close each month, rebuild the forecast with new data and updated assumptions. For stable businesses, quarterly may be enough. For fast-moving businesses (SaaS, e-commerce), weekly flashes can help, but the full reforecast should still be monthly.
Should we report against the budget or the forecast?
Report both. Show actual vs budget (to assess if original targets were realistic) and actual vs forecast (to show if current trends are on track). The forecast is often more useful for decision-making; the budget is useful for accountability.
What's the difference between a plan and a budget?
Plan is a long-range (3-5 year) strategic vision of where the business is heading. Budget is a detailed one-year financial plan that translates the strategy into monthly targets. Plan is directional; budget is specific and tied to accountability.