
 By
You have $500K in IT costs serving five departments. Engineering uses 40% of development resources. Marketing uses 30% for campaign infrastructure. Sales uses 20% for CRM and analytics. Finance and HR split 10%. How much of that $2M belongs in each P&L?
Cost allocation is the process of answering that question fairly and consistently.
Most companies allocate shared costs: IT, HR, Facilities, Finance, Compliance, Corporate overhead. They need to know the true cost of running each department and each product line. But the way you allocate matters enormously. Choose wrong, and you misguide pricing, product mix, and hiring decisions. Choose right, and you can see the true profitability of every channel and customer segment.
This guide covers: what cost allocation is, the three main methods (headcount-based, revenue-based, activity-based), how to set allocation keys, common pitfalls, and how consumer brands allocate fulfillment and marketing costs across DTC, Amazon, and wholesale channels.
What is Cost Allocation?
The 50-word definition
Cost allocation is the process of assigning a portion of shared or indirect costs to departments, products, business units, or cost centers based on a driver or allocation key. It shows the full cost of running a department, including overhead. Formula: Total Shared Cost / Allocation Base = Rate per Unit
Shared costs are incurred for the whole company and benefit multiple departments. Examples include:
- IT and Systems: Server infrastructure, software licenses, network, cybersecurity
- HR and Payroll: Benefits administration, recruiting, learning and development, employee relations
- Facilities: Rent, utilities, maintenance, janitorial, parking
- Finance and Compliance: Accounting, audits, tax, legal, insurance
- Corporate overhead: Executive team, board, investor relations, strategic planning
Without allocation, each department looks cheap: "IT is only $50K, HR is $30K." With allocation, you see the real cost: "Engineering is $200K direct spend + $60K IT share + $40K HR share = $300K total cost." That drives better decisions.
Why allocate?
- Board and investor reporting: Show the fully absorbed cost of running the business.
- Product profitability: Understand the true cost to serve each product or customer segment.
- Pricing decisions: Know what overhead sits behind your gross margin.
- Make vs. buy decisions: Is it cheaper to build in-house or outsource? Full cost allocation answers it.
- Tax planning: Some allocations are required for tax and regulatory reporting.
Cost Allocation Methods and Keys
The allocation method is the rule you use to assign shared costs. The method should correlate with cost consumption: if IT costs scale with headcount, use headcount. If they scale with revenue, use revenue. The better the match, the fairer and more actionable the allocation.
Method 1: Headcount-Based Allocation (Most Common)
How it works: Total shared cost / Total company headcount = Cost per employee. Each department absorbs its allocated share based on its headcount.
| Department | Headcount | IT Cost per Head | Allocated IT Cost |
|---|---|---|---|
| Engineering | 50 | $1,500 | $75,000 |
| Marketing | 15 | $1,500 | $22,500 |
| Sales | 20 | $1,500 | $30,000 |
| Finance | 5 | $1,500 | $7,500 |
| Operations | 10 | $1,500 | $15,000 |
| Total | 100 | $150,000 |
Best for: IT costs, HR costs, general overhead that scales with team size.
Drawback: Ignores variation in actual system usage. Engineering may use 5x more server capacity than Marketing, but both are charged the same per head.
Method 2: Revenue-Based Allocation
How it works: Total shared cost / Total company revenue = Cost per dollar of revenue. Each business unit absorbs allocation based on revenue generated.
| Business Unit | Annual Revenue | Allocation Rate (3%) | Allocated Cost |
|---|---|---|---|
| Enterprise | $50M | 3% | $1,500,000 |
| Mid-Market | $30M | 3% | $900,000 |
| SMB | $20M | 3% | $600,000 |
| Total | $100M | $3,000,000 |
Best for: Sales support, customer success, marketing spend that scales with revenue.
Drawback: Can distort profitability. A high-revenue, low-margin product absorbs more allocation than a low-revenue, high-margin one.
Method 3: Activity-Based Allocation
How it works: Total shared cost / Actual activity units (transactions, orders, calls, etc.) = Cost per activity. Each department is charged based on actual usage.
Example: Data center costs allocated by number of API calls per team.
| Team | Monthly API Calls | Cost per 1M Calls | Allocated Cost |
|---|---|---|---|
| Platform | 50M | $200 | $10,000 |
| Analytics | 20M | $200 | $4,000 |
| Third-party integrations | 30M | $200 | $6,000 |
| Total | 100M | $20,000 |
Best for: IT infrastructure, warehouse space, customer support (tickets processed), logistics costs.
Advantage: Most accurate and fair when activity data is available.
Drawback: Requires detailed activity tracking and is harder to implement.
Method 4: Direct Assignment (No Allocation)
Some FP&A teams avoid allocation altogether. Instead, they place shared costs in a single "Corporate" or "Unallocated" cost center on the P&L.
As one FP&A Director noted: "We used to allocate a lot of costs within my division and have since shut it down as much as we could. It wasn't changing management decisions for those who received dollars and for those where the dollars started, before they were allocated, it was hiding the truth of what was in their control."
Benefit: Accountability is clear. Sales owns sales spend. Marketing owns marketing spend. Allocation arguments disappear.
Drawback: The true cost of each department is hidden until you manually add corporate costs back in.
Worked Examples: Implementing Cost Allocation
Example 1: B2B SaaS (Headcount-Based)
Illustrative example:
- Total IT budget: $500K/year
- Total company headcount: 100
- Allocation rate: $500K / 100 = $5,000 per employee per year
| Department | Headcount | Direct Costs | IT Allocation | Total Cost | Cost per Employee |
|---|---|---|---|---|---|
| Engineering | 35 | $2.1M | $175K | $2.275M | $65K |
| Sales | 20 | $1.2M | $100K | $1.3M | $65K |
| Marketing | 15 | $500K | $75K | $575K | $38K |
| Operations | 30 | $800K | $150K | $950K | $32K |
| Total | 100 | $4.6M | $500K | $5.1M | $51K |
The board now sees that running the company costs $5.1M total, not $4.6M direct. The true cost per employee is $51K, not $46K.
Example 2: Ecommerce (Revenue-Based Allocation)
Illustrative example:
Allocating shared customer success and fulfillment overhead across three sales channels:
| Channel | Revenue | COGS | Direct Cost | Overhead Share (5%) | Total Cost | Margin % |
|---|---|---|---|---|---|---|
| DTC | $5M | $1.5M | $800K | $250K | $2.55M | 49% |
| Amazon | $3M | $1M | $400K | $150K | $1.55M | 48% |
| Wholesale | $2M | $800K | $200K | $100K | $1.1M | 45% |
| Total | $10M | $3.3M | $1.4M | $500K | $5.2M | 48% |
Allocating overhead as a flat 5% of revenue is simple, but it assumes every channel uses overhead in proportion to sales. They rarely do, which is why the consumer-brand example below uses usage drivers instead.
For Consumer Brands: Allocating Shared Fulfillment and Marketing Costs Across Channels
Consumer brands selling DTC + Amazon + wholesale + retail face a unique allocation challenge: shared fulfillment costs, shared marketing resources, shared customer service infrastructure, and brand-level overhead all serve multiple channels with different economics.
The challenge
- 3PL and fulfillment: One warehouse handles DTC direct-to-consumer packs, Amazon FBA prep (different box size, labeling, pallet requirements), and wholesale case packing. Each channel has different handling costs, not captured by simple revenue splits.
- Shared marketing resources: One performance marketing team (salary $120K/year) splits time across DTC paid search, Amazon Ads (which are platform fees, not marketing spend), and marketplace campaigns. Time allocation beats revenue allocation here.
- Customer service: One team field DTC Shopify inquiries, Amazon Seller Central messages, and wholesale partner POs. Inquiries per channel drive cost, not revenue.
- Brand overhead: Corporate marketing, product development, buying, and compliance costs serve all channels. Which channels pay for these?
- SKU x channel complexity: 300 SKUs, 4 channels, 24 months, 10 allocation keys = 288K data points. Spreadsheet allocation cascades into errors monthly.
Worked allocation: $2M shared cost pool across 3 channels
Illustrative example: a brand with $8.0M revenue (DTC $3.0M, Amazon $3.5M, wholesale $1.5M) has $2.0M of shared costs. Contribution before shared costs (after COGS, channel fees and direct marketing) is DTC 30% ($900K), Amazon 20% ($700K) and wholesale 25% ($375K). All figures are example assumptions.
| Shared cost pool | Annual cost | Driver | DTC | Amazon | Wholesale | Rate |
|---|---|---|---|---|---|---|
| 3PL storage | $250K | Cubic feet stored | 10,000 | 6,000 | 6,000 | $11.36 per cu ft |
| 3PL pick, pack and receiving labor | $350K | Labor hours per year | 7,000 | 2,500 | 1,500 | $31.82 per hour |
| Shared marketing team | $150K | Time-tracked hours | 900 | 375 | 225 | $100 per hour |
| Customer service | $100K | Tickets per year | 2,400 | 3,000 | 600 | $16.67 per ticket |
| Brand overhead (product, compliance, admin) | $1,150K | Not allocated: kept at corporate |
| Result ($K) | DTC | Amazon | Wholesale | Total |
|---|---|---|---|---|
| Contribution before shared costs | $900.0 | $700.0 | $375.0 | $1,975.0 |
| Driver-based allocation of the $850K | ($466.4) | ($235.2) | ($148.4) | ($850.0) |
| Contribution after shared costs (driver-based) | $433.6 (14.5%) | $464.8 (13.3%) | $226.6 (15.1%) | $1,125.0 |
| Revenue-based allocation of the same $850K | ($318.8) | ($371.9) | ($159.4) | ($850.0) |
| Contribution after shared costs (revenue-based) | $581.2 (19.4%) | $328.1 (9.4%) | $215.6 (14.4%) | $1,125.0 |
| Brand overhead (corporate) | ($1,150.0) | |||
| Operating profit | ($25.0) |
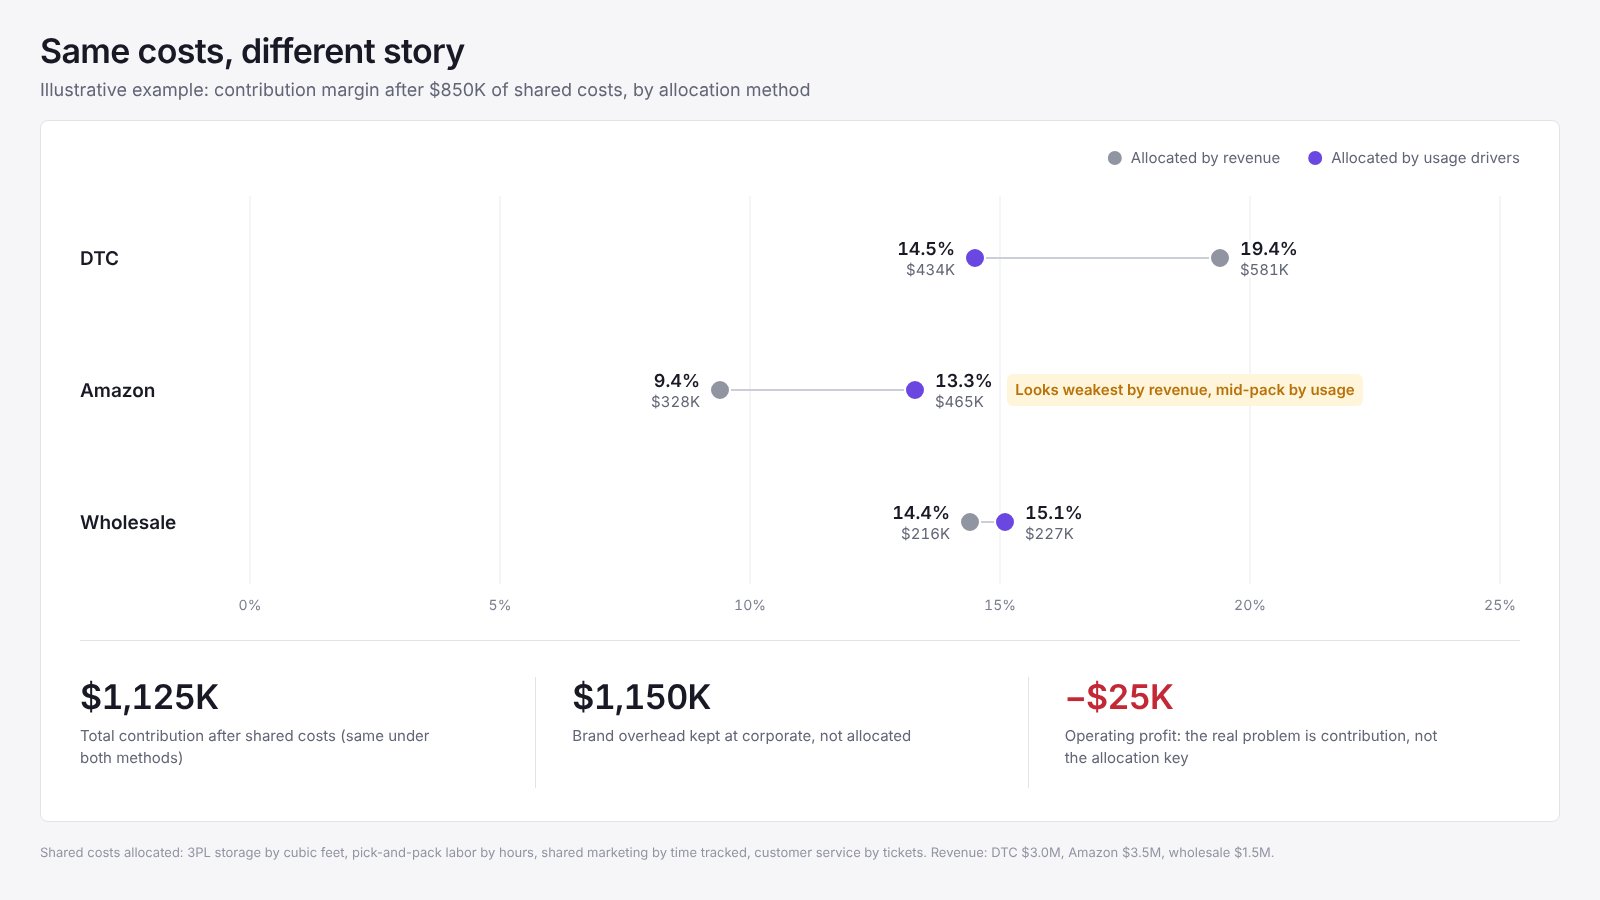
What changes with the driver: the total never changes ($1,125K either way), but the story does. Allocated by revenue, Amazon looks like the weak channel at 9.4% and DTC the star at 19.4%. Allocated by what each channel actually uses, the three channels sit within two points of each other, because DTC single-unit orders consume most of the pick-and-pack labor while Amazon inventory sits in FBA rather than your 3PL. A team using the revenue method might cut Amazon investment for the wrong reason.
Why brand overhead stays unallocated here: product development, compliance and admin do not scale with any channel driver. Spreading them by revenue adds noise without adding information. Showing them as one corporate line makes the real question visible: together the channels contribute $1,125K against $1,150K of overhead, so the business is roughly break-even and needs more contribution, not a better allocation key.
Alternative: Driver-based allocation (most accurate)
Critical decision: Allocate everything or isolate corporate?
Two schools of thought:
- Full allocation: Every channel absorbs its share of corporate costs. Board sees true channel profitability. But allocation disputes can distort channel mix decisions.
- Isolate corporate: Channels own their direct costs (COGS, fulfillment, marketing spend, channel-specific overhead). Corporate costs go to unallocated. Board sees CM2 or CM3 by channel, sees unallocated overhead separately. More transparent, less political.
Most consumer brands use hybrid: allocate direct shared costs (3PL, shared team salaries) by driver, but isolate corporate overhead in one cost center. This preserves channel profitability visibility without endless allocation debates.
This is where FP&A for consumer brands shines: reconciling channel P&Ls to the books while allocating shared costs fairly. By tracking CM1/CM2/CM3 per channel with precise allocation keys updated monthly, you can see which channels truly pay for overhead and which subsidize others. The allocation method you choose (driver-based vs revenue-based) directly drives channel mix decisions and profitability insights.
Common Cost Allocation Pitfalls
Pitfall 1: Allocation Based on Inaccurate or Stale Data
Using headcount from six months ago when headcount has changed, or revenue from old budgets instead of actuals, creates allocation noise and erodes trust.
Fix: Update allocation keys monthly or quarterly based on actual data. Automate if possible.
Pitfall 2: Allocation Keys That Don't Correlate with Cost
Allocating IT costs evenly across all employees when Engineering uses 80% of capacity, or allocating rent by headcount when some departments don't use office space.
Fix: Choose a driver that actually correlates with cost consumption. Survey actual usage if needed.
Pitfall 3: Endless Allocation Arguments
Finance says "Your allocation is $200K." Sales says "We only caused $100K of this cost; why are we paying for HR?" Months pass.
Fix: Be clear and transparent about the allocation method. Communicate it once, then enforce it consistently. If allocation becomes a political battle, consider direct assignment and isolating overhead in one cost center.
Pitfall 4: Using Allocations for Accountability When You Should Use Direct Spend
Telling a department head "You overspent on IT allocation" when they have no control over IT usage or spending.
Fix: Use allocations for visibility (board reporting, true cost of service). Use direct spend for accountability. Don't blame a department for allocated overhead they didn't control.
Turning Allocation Complexity Into Clarity
For consumer brands with multiple channels and SKUs, cost allocation becomes a spreadsheet nightmare. 500 SKUs, 4 channels, 12 months, 10 allocation keys = thousands of manual calculations.
That's where FP&A systems step in: reconciling channel P&Ls to the books, automating allocation by headcount, revenue, or activity, and recalculating monthly. When you hire two new fulfillment employees, the allocation automatically adjusts. When Amazon fees change, the model recalculates CM3 across all products and channels in seconds.
Stop fighting allocation spreadsheets.
Niblin's FP&A platform reconciles channel P&Ls with automated cost allocation (by headcount, revenue, or activity), live in weeks. See the true contribution margin of every channel after shared costs, without rebuilds when your business changes shape.
See how Niblin models it
Key Takeaways
- Cost allocation assigns shared costs (IT, HR, overhead) to departments or products based on a driver (headcount, revenue, activity).
- Headcount-based allocation is most common for IT and HR costs. Revenue-based works well for sales support. Activity-based is most accurate but requires detailed tracking.
- Allocation improves board reporting and pricing decisions, but can dilute accountability if misused.
- The allocation key should correlate with cost consumption. If it doesn't, allocation becomes a political argument.
- For consumer brands, allocate fulfillment by units shipped, marketing by revenue or spend, and customer service by inquiries.
- Avoid excessive allocation. Use allocations for visibility; use direct spend for accountability.
- Allocation is a process, not a one-time exercise. Update keys monthly or quarterly based on actual data.
Frequently Asked Questions
What is cost allocation?
Cost allocation is assigning a portion of shared costs (IT, HR, overhead) to departments, products, or business units based on a driver or allocation key. It shows the full cost of running each part of the business, including overhead.
What is an allocation key?
An allocation key is the basis or driver used to assign shared costs. Common keys are headcount (for IT, HR), revenue (for sales support), square footage (for facilities), or activity units like orders or transactions. The key should correlate with actual cost consumption.
Should I allocate all shared costs?
Not necessarily. Allocations are useful for board reporting, pricing, and understanding true profitability by product or channel. However, excessive allocation can obscure accountability. Many FP&A teams isolate allocations in a single "Corporate" cost center and hold departments accountable only for direct spend.
What is the difference between direct assignment and allocation?
Direct assignment assigns costs only to departments that directly incurred them. Allocation assigns a share of indirect or shared costs based on a driver. Direct assignment is simpler but hides overhead. Allocation shows true cost but requires fairness agreements.
How often should I update allocation keys?
Update allocation keys at least quarterly, ideally monthly. If headcount changes materially, update immediately. Stale allocation data creates inaccuracy and erodes trust. Automate updates when possible.
For consumer brands, how should I allocate fulfillment costs across channels?
Allocate fulfillment by units shipped or by fulfillment hours worked per channel. This is activity-based allocation and most accurately reflects cost consumption. DTC, FBA prep, and wholesale prep all have different handling costs.