
 By
You build an income statement. Revenue looks right. Expenses look right. Net income is positive. You feel good.
Then you look at cash flow. You made $500K net income, but cash only grew $100K. What happened to the other $400K?
That's the reality of three-statement modeling. The three statements tell three different stories about the same business. The income statement shows profitability. The balance sheet shows the health of assets and liabilities. The cash flow statement shows whether the company is actually generating cash.
A three-statement model ties all three together so that when you change one assumption, all three statements update correctly. It's the foundation of FP&A.
What Is a Three-Statement Financial Model?
The 55-word definition
A three-statement financial model is an Excel or modeling tool that links the income statement, balance sheet, and cash flow statement so that changes in one automatically update the others. It forecasts all three statements simultaneously and ensures internal consistency: net income from the P&L feeds retained earnings on the balance sheet; changes in balance sheet accounts drive the cash flow statement.
The three statements answer three separate questions:
- Income Statement: Is the company profitable? (Revenue − Expenses = Net Income)
- Balance Sheet: What does the company own and owe? (Assets = Liabilities + Equity)
- Cash Flow Statement: Is the company generating cash? (Operating + Investing + Financing Cash Flows)
A three-statement model ensures all three are internally consistent. If net income changes, retained earnings change, which might change shareholder equity, which needs to be funded by cash or debt.
The Three Statements: What Each One Measures
Statement 1: Income Statement (P&L)
The income statement measures profit over a period (month, quarter, year). It is the simplest of the three to understand.
Structure:
Revenue
− Cost of Goods Sold
= Gross Profit
− Operating Expenses
= Operating Income (EBIT)
± Interest expense (or income)
± Taxes
= Net Income
Every item on the income statement is either a source of cash (revenue) or a use of cash (expense). But not all income statement items move cash in the same period. That's why you need a cash flow statement.
Statement 2: Balance Sheet
The balance sheet is a snapshot at a point in time (end of month, quarter, year). It shows what the company owns (assets), what it owes (liabilities), and the residual value to shareholders (equity).
The balance sheet equation:Assets = Liabilities + Shareholder Equity
Assets: Cash, accounts receivable, inventory, fixed assets (equipment, buildings)
Liabilities: Accounts payable, debt, accrued expenses
Equity: Common stock + Retained earnings (cumulative net income, minus dividends)
The balance sheet must always balance. If it doesn't, you have a formula error or a missing entry.
Statement 3: Cash Flow Statement
The cash flow statement explains changes in cash from one period to the next. It has three sections.
Structure:
Cash Flow from Operations (CFO)
= Net Income + Non-cash items − Changes in working capital
Cash Flow from Investing (CFI)
= Capital expenditures, asset sales
Cash Flow from Financing (CFF)
= Debt issuance/repayment, equity raises, dividends
Change in Cash = CFO + CFI + CFF
The cash flow statement bridges the income statement and balance sheet. It explains why net income does not equal change in cash.
Build Order: Which Statement to Build First
The correct order is: Income Statement > Balance Sheet > Cash Flow Statement.
If you build them out of order, you will create circular references or have to rebuild multiple times.
Step 1: Build the Income Statement
- Set up revenue drivers (units sold, price per unit, subscription growth, etc.)
- Calculate COGS as a % of revenue or per-unit basis
- Add operating expenses (salaries, rent, depreciation, etc.)
- Calculate operating income (EBIT)
- Add interest expense (based on debt), taxes
- Calculate net income
The income statement is the simplest because it only depends on assumptions you set. It does not depend on the balance sheet or cash flow statement.
Step 2: Build the Balance Sheet
- Start with beginning balance sheet (last period)
- Add net income from the income statement to retained earnings
- Model working capital accounts: accounts receivable (based on revenue), inventory (based on COGS), accounts payable (based on COGS)
- Model fixed assets: prior period balance + capital expenditures − depreciation
- Model debt and equity
- Ensure the balance sheet balances: Assets = Liabilities + Equity
The balance sheet depends on net income from the income statement, so you build it second. As you build it, you will identify what debt or equity is needed to balance the balance sheet.
Step 3: Build the Cash Flow Statement
- Start with net income from the income statement
- Add back depreciation and other non-cash charges
- Calculate changes in working capital accounts (the difference in AR, inventory, AP from prior period)
- Add capital expenditures (from the balance sheet)
- Add or subtract debt and equity changes (from the balance sheet)
- The change in cash should tie to the change in cash on the balance sheet
The cash flow statement ties the income statement and balance sheet together. If you build it last, all the linkages are already in place, and you can verify the model is internally consistent.
Why this order?
Building in this order minimizes circular references and ensures you build dependencies in the right direction. Revenue drives the income statement. Net income drives the balance sheet. The balance sheet drives the cash flow statement.
How the Three Statements Link Together
The income statement feeds the balance sheet
Net income from the income statement goes directly to retained earnings on the balance sheet. Retained earnings = prior period retained earnings + current period net income − dividends.
Retained Earnings (BS) = Retained Earnings (prior period, BS) + Net Income (IS) − Dividends
The balance sheet drives the cash flow statement
Changes in balance sheet accounts create working capital movements that affect cash. If accounts receivable goes up, cash went down (you sold on credit, not for cash). If inventory goes down, cash went up (you converted inventory to sales).
Change in Accounts Receivable = AR (end of period, BS) − AR (prior period, BS)
If AR increased by $100K, cash decreased by $100K (use of cash). This goes on the cash flow statement as a reduction to CFO.
The income statement and balance sheet drive the cash flow statement
Operating cash flow starts with net income from the income statement. Then you adjust for non-cash items (depreciation, amortization) and changes in working capital accounts (AR, inventory, AP) from the balance sheet.
| Item | Source | Direction |
|---|---|---|
| Net Income | Income Statement | Starting point for CFO |
| Depreciation | Income Statement | Add back (non-cash charge) |
| Change in AR | Balance Sheet | Subtract if increased (use of cash) |
| Change in Inventory | Balance Sheet | Subtract if increased (use of cash) |
| Change in AP | Balance Sheet | Add if increased (source of cash) |
| CapEx | Balance Sheet | Subtract from CFI |
| Debt raised | Balance Sheet | Add to CFF |
| Dividends paid | Assumed | Subtract from CFF |
The check: does change in cash equal change in cash on the balance sheet?
At the end, the change in cash from the cash flow statement must equal the change in cash on the balance sheet (ending cash − beginning cash). If it doesn't, you have a link error.
Ending Cash (CFF from Cash Flow Statement) = Beginning Cash (Balance Sheet, prior period) + Change in Cash (CFF, CFI, CFO)
Common Balancing Errors and How to Fix Them
Error 1: Balance sheet does not balance
Assets ≠ Liabilities + Equity. This is the most common error, especially for beginners.
Cause: Usually a missing link (net income was not added to retained earnings) or a formula mistake in a working capital account.
Debug strategy (from experienced modelers): Set each variable to zero, one by one. When the balance sheet goes from unbalanced to balanced, the variable you just zeroed is the source of the error. This always works.
- Set revenue to zero. Does the balance sheet balance? If yes, the error is in revenue-driven items (AR, COGS, CapEx, etc.)
- If not, set expenses to zero.
- Keep narrowing until you find the culprit.
- Once you know the source, fix the formula.
Error 2: Cash flow does not tie to change in cash on balance sheet
Your cash flow statement shows a $200K increase in cash, but the balance sheet shows cash only increased $100K.
Cause: Usually missing or double-counted items. Common culprits:
- Depreciation or amortization: added in CFF but not added back in CFO
- Stock-based compensation: counted in expenses but not added back as non-cash
- Changes in working capital: counted twice (once in CFF, once in the change in AR/inventory/AP)
- CapEx: included in the balance sheet change but not deducted separately in CFI
Fix: Check that every balance sheet change is accounted for exactly once in the cash flow statement. Use a waterfall: all balance sheet changes should be explained by CFO + CFI + CFF.
Error 3: Circular references
Excel shows a "circular reference" warning and will not calculate.
Cause: You are trying to make the balance sheet balance by linking it to something that depends on the balance sheet (example: interest expense depends on debt, but debt balances the balance sheet, creating a loop).
Fix: Use a "plug" variable (usually new debt or cash) that adjusts to make the balance sheet balance, but do not link that plug back to the income statement or cash flow. The plug is the residual that balances everything else.
Error 4: Retained earnings does not reconcile
Retained earnings on the balance sheet should equal: prior period retained earnings + net income − dividends. If it doesn't, net income was not properly linked from the income statement.
Check: Retained Earnings = Retained Earnings (prior) + Net Income (IS) − Dividends. If the formula is not exactly this, fix it.
Worked Example: Three-Statement Model for a $10M Consumer Brand
Illustrative example: BeautyBrand sells DTC (40% of revenue), on Amazon (35%) and through wholesale (25%). All figures are in $K and are example assumptions, not benchmarks. Replace them with your own.
Assumptions
- Revenue: $10,000 (DTC $4,000, Amazon $3,500, wholesale $2,500)
- Gross margin after channel fees: DTC 50%, Amazon 45%, wholesale 40%
- Operating expenses: $3,000. Depreciation: $100. Capex: $70
- Debt: $500 at 5% interest. Tax rate: 21%
- Receivable days: DTC 2 (card settlement), Amazon 14 (disbursement cycle), wholesale 60 (net 60 terms)
- Inventory days of COGS: DTC 60, Amazon 90 (includes FBA inbound stock), wholesale 60
- Supplier payable days: 45 days of total COGS
- Opening balance sheet: cash $500, fixed assets $700, debt $500, common stock $700 (assets $1,200 = liabilities + equity $1,200)
Income statement (Year 1, $K)
| Line | Amount | How it is calculated |
|---|---|---|
| Revenue | $10,000 | $4,000 + $3,500 + $2,500 |
| COGS | ($5,425) | DTC $2,000 + Amazon $1,925 + wholesale $1,500 |
| Gross profit | $4,575 | 45.8% blended gross margin |
| Operating expenses | ($3,000) | |
| EBITDA | $1,575 | |
| Depreciation | ($100) | |
| EBIT | $1,475 | |
| Interest | ($25) | 5% x $500 debt |
| Pre-tax income | $1,450 | |
| Tax | ($305) | 21% x $1,450, rounded |
| Net income | $1,145 | Flows to retained earnings and to the top of the cash flow statement |
Working capital build (end of Year 1, $K)
| Item | DTC | Amazon | Wholesale | Total |
|---|---|---|---|---|
| Accounts receivable (revenue / 365 x days) | $22 | $134 | $411 | $567 |
| Inventory (COGS / 365 x days) | $329 | $475 | $247 | $1,051 |
| Accounts payable (45 days of total COGS) | $669 |
Cash flow statement (Year 1, $K)
| Line | Amount |
|---|---|
| Net income | $1,145 |
| Add back depreciation | $100 |
| Increase in receivables | ($567) |
| Increase in inventory | ($1,051) |
| Increase in payables | $669 |
| Cash from operations | $296 |
| Capex | ($70) |
| Cash from financing | $0 |
| Net change in cash | $226 |
| Ending cash | $726 (opening $500 + $226) |
Balance sheet (opening vs end of Year 1, $K)
| Line | Opening | End of Year 1 | Link |
|---|---|---|---|
| Cash | $500 | $726 | Ending cash from the cash flow statement |
| Accounts receivable | $0 | $567 | Working capital build |
| Inventory | $0 | $1,051 | Working capital build |
| Fixed assets (net) | $700 | $670 | $700 + $70 capex - $100 depreciation |
| Total assets | $1,200 | $3,014 | |
| Accounts payable | $0 | $669 | Working capital build |
| Debt | $500 | $500 | No repayment |
| Common stock | $700 | $700 | |
| Retained earnings | $0 | $1,145 | Opening $0 + net income $1,145 - dividends $0 |
| Total liabilities + equity | $1,200 | $3,014 | Balances: $3,014 = $3,014 |
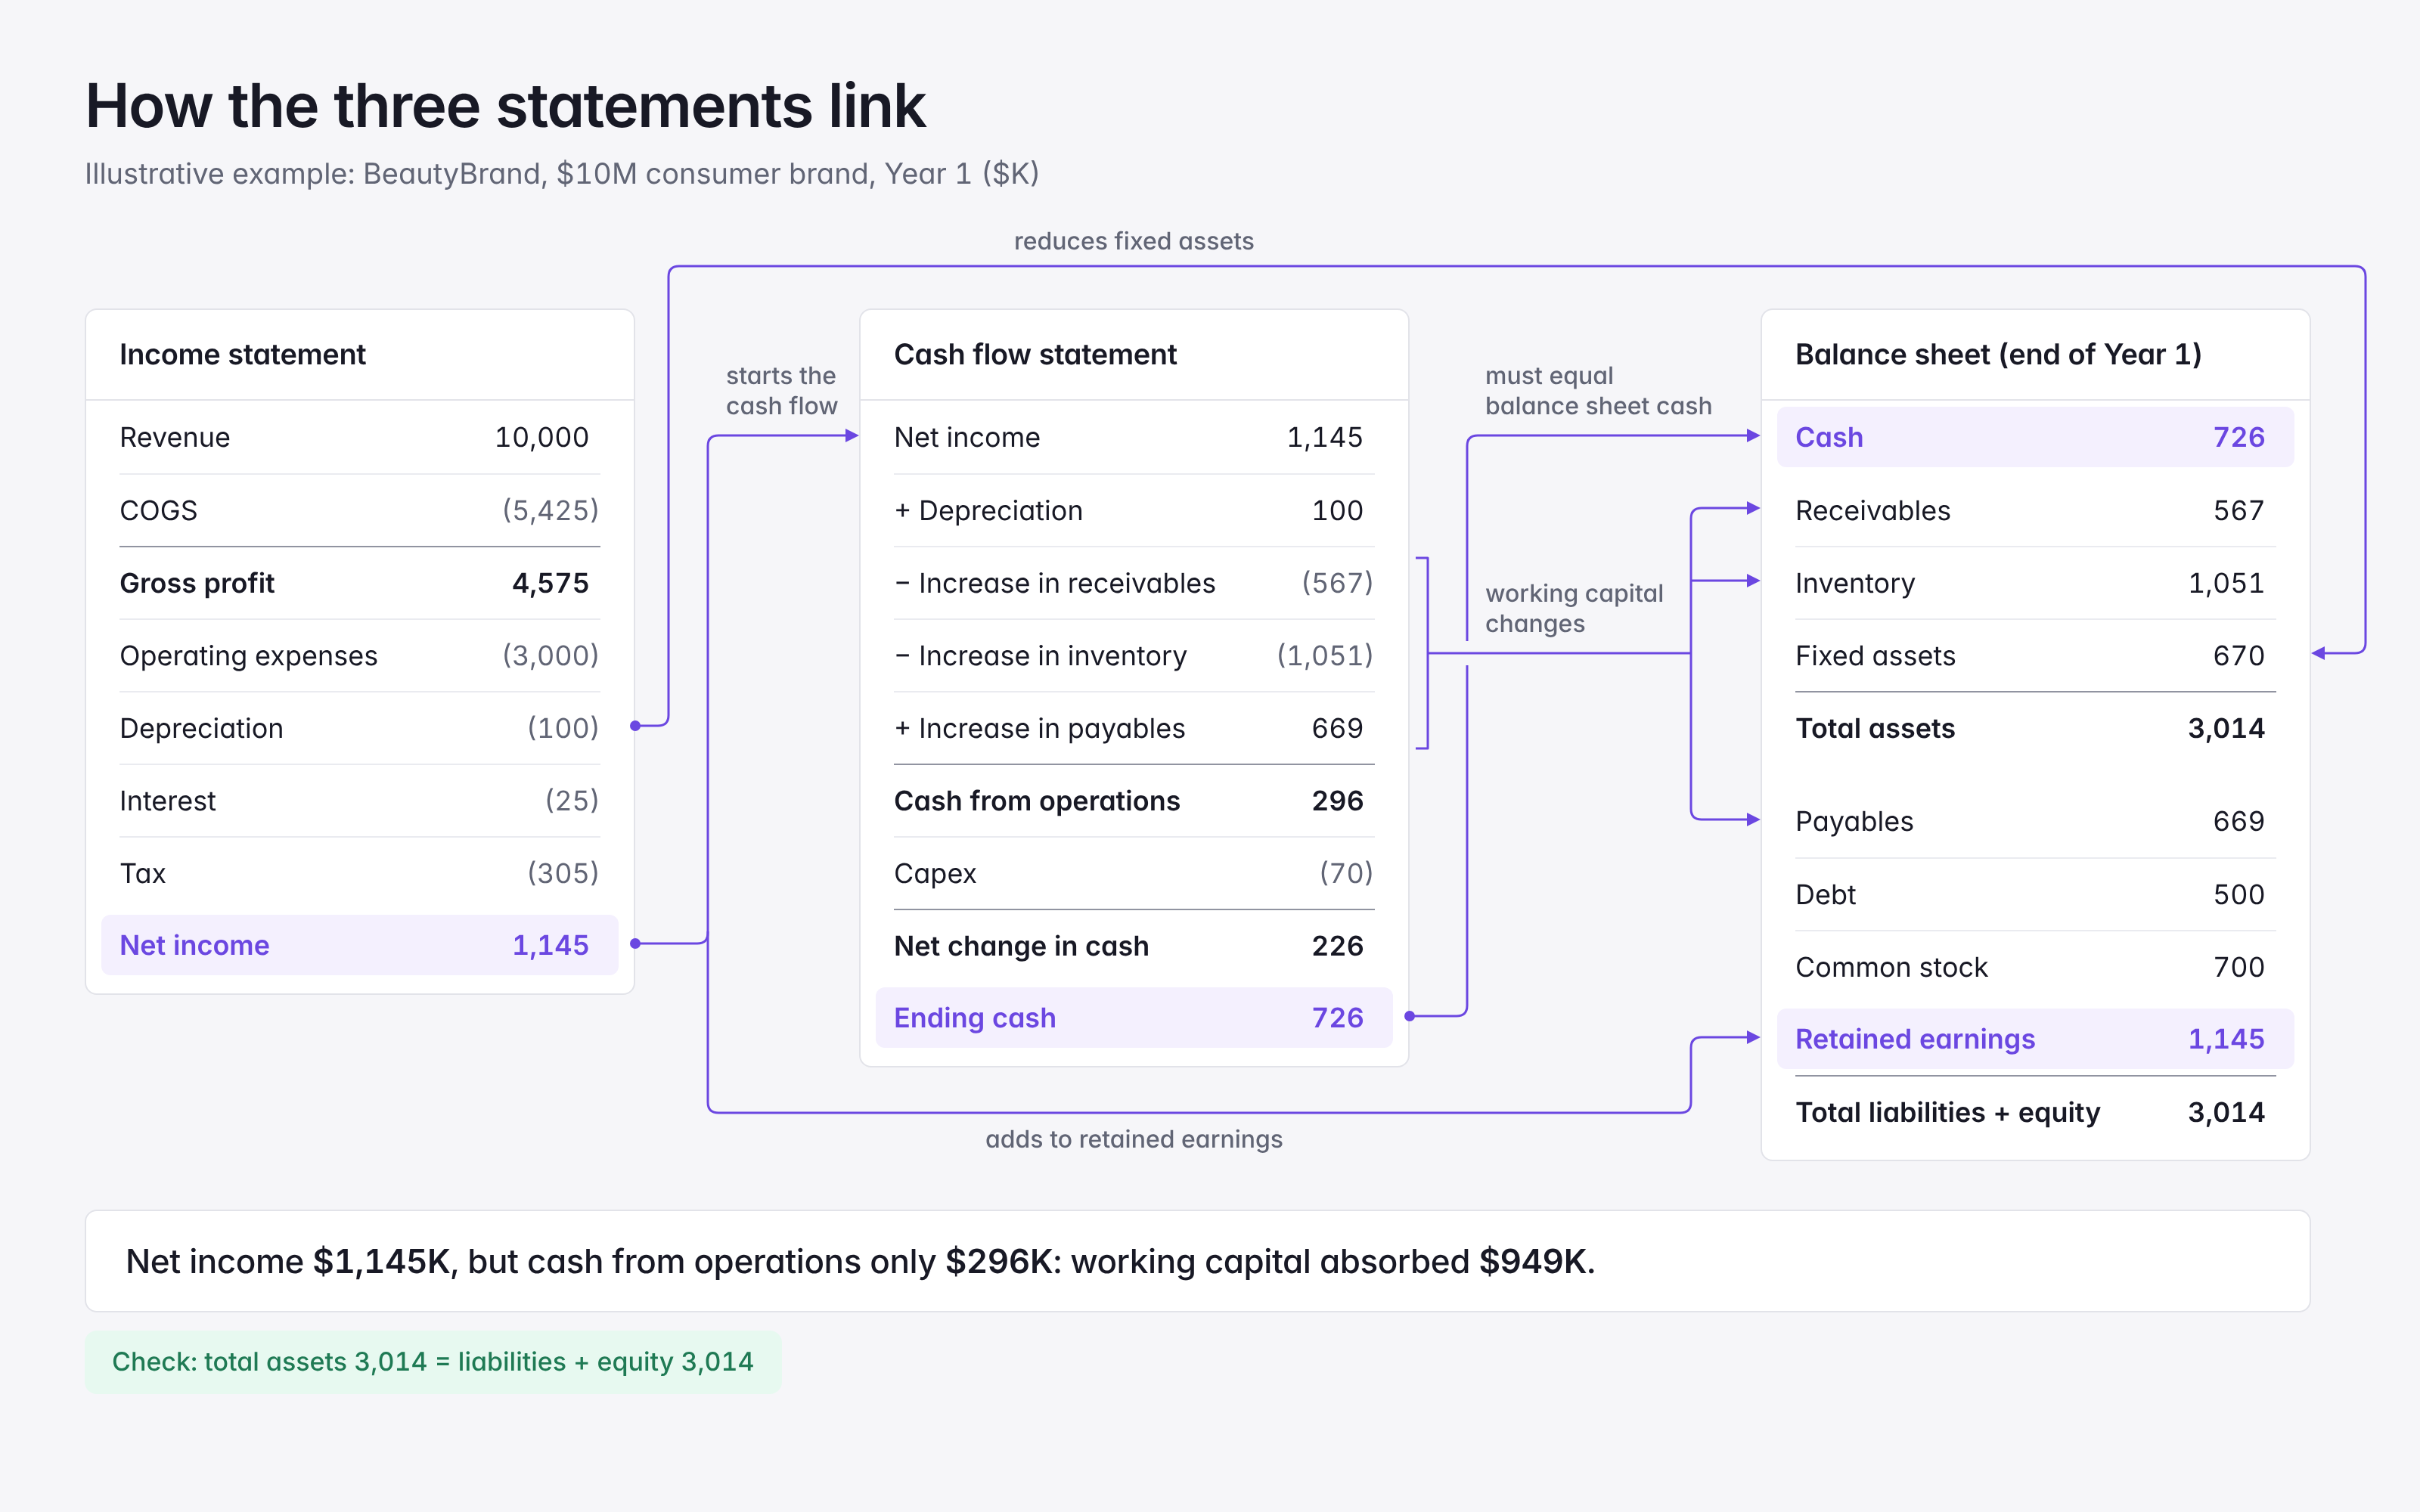
What the model shows: BeautyBrand earned $1,145K of net income but generated only $296K of operating cash. Working capital absorbed $949K: $567K of receivables plus $1,051K of inventory, less $669K funded by suppliers. Most of that sits in Amazon inventory and wholesale receivables, which is why channel mix matters as much as margin when you plan cash.
The two checks to run every time: total assets equal total liabilities plus equity in every period, and ending cash on the cash flow statement equals cash on the balance sheet. If either fails, a link is broken: usually a working capital line that changed on the balance sheet but not on the cash flow statement, or capex that was added to fixed assets but not deducted from cash.
For Consumer Brands: Three-Statement Complexity With Multiple Channels
For consumer brands, a three-statement model must incorporate inventory, trade payables, seasonal cash swings, and channel-specific profitability. A $10M brand with DTC, Amazon, and wholesale channels faces modeling complexity that a simple single-channel model does not.
Added complexity: the cash trap
- Inventory by channel: DTC inventory is held in a 3PL. Amazon inventory is in FBA. Wholesale inventory sits at distributors. Inventory holding days vary widely by channel and business model.
- Accounts receivable by channel: DTC collects quickly (Shopify / Stripe). Amazon and wholesale have longer payment lags. Retail partners often deduct chargebacks, discounts, and markdown allowances. Total AR depends on channel mix.
- Trade payables by channel: COGS and payment terms vary by channel. Suppliers may offer net 30, net 60, or other terms. Cash outflow timing often precedes cash inflow.
- Seasonal working capital: Peak seasons (e.g., Q4) require inventory build ahead of sales. You must invest in inventory before collecting cash, creating a working capital requirement.
- Channel mix shift: If you add or shift to a new channel, inventory holding, AR, and AP profiles change. Different channels have different cash rhythms. Model the impact channel-by-channel.
The worked example above shows the effect: a profitable year can still leave a brand short of cash once inventory and wholesale receivables are funded. Model these lines by channel, then roll them up into the three statements.
Three critical linkages for consumer brands
- Revenue drives AR and inventory, which both drive payables: If you add Amazon, revenue goes up by 35% but AR and inventory go up differently. Amazon ties up inventory in FBA before it sells, and wholesale collects on net terms. You must finance that gap with cash, payables or debt.
- Net income flows to retained earnings, which must cover working capital needs: If you forecast $1M net income but working capital consumes $800K, you only have $200K to reinvest in growth or to distribute. This is why many fast-growing consumer brands are cash-constrained despite being profitable.
- Balance sheet must balance every period, or you have missing cash/debt: If AR + Inventory exceeds AP, you need cash or debt to balance. The "plug" is usually cash or new debt raised. Consumer brands raising Series A or Series B are often raising money to fund working capital, not operations.
Best practice: model at SKU x channel level, aggregate to three statements
- Build a detailed demand forecast by SKU and channel
- Calculate channel-specific COGS (different manufacturing, packaging, inbound freight, fulfillment)
- Forecast inventory and AR by channel (holding days and payout terms)
- Forecast payables by supplier and channel (payment terms × COGS)
- Aggregate all channels to revenue, COGS, working capital, and payables on the consolidated balance sheet
- Link to the three-statement model and verify balance sheet balances each month
This is where Niblin adds value for consumer brands: the three-statement model is integrated with SKU, channel, and working capital detail, so when you change a forecast or add a channel, working capital automatically recalculates. You forecast the impact on AR, inventory, payables, cash, and debt without building three separate models. You can model "what if we expand Amazon from 35% to 50% of revenue?" and see the exact cash and debt impact.
FAQ: Three-Statement Modeling Questions
Q: Do I need a three-statement model for forecasting, or just for reporting?
You need it for both. For reporting, it ensures accuracy: net income on the income statement ties to retained earnings on the balance sheet, which ties to the cash flow statement. For forecasting, it shows the cash implications of profit. A company can be profitable and still run out of cash if working capital consumes it.
Q: What is the "plug" variable and when do I use it?
The plug is a balance sheet account that adjusts so the balance sheet balances. Usually it is cash or debt. If your assets exceed liabilities plus equity, you need cash or debt to balance. The plug changes every period based on profitability and working capital needs.
Q: Can I build a three-statement model without linking the statements?
You can, but you will lose the power of the model. Unlinked statements are just separate spreadsheets. A linked model ensures that when you change an assumption (revenue growth, headcount, inventory days), all three statements update automatically and correctly.
Q: Which statement should I focus on for decision-making?
All three, but for different reasons. The income statement drives profit and incentives. The balance sheet drives financial health (how much debt can we take, what is working capital risk?). The cash flow statement drives survivability. The best decisions account for all three.
Q: How often should I update the three-statement model?
Update it whenever assumptions change: new revenue forecast, CapEx plan, debt issuance, or seasonality. Most companies update quarterly (after actual results close) or monthly (rolling forecast). The model is a tool; use it as frequently as decisions require it.
Building three-statement models for omnichannel consumer brands is complex: inventory across channels, trade payables, seasonal cash swings. See how Niblin automates three-statement modeling so your forecast changes ripple correctly through all three statements. Get started