
 By
"Its considered more strategic and you work closer with the business operators. Meaning you have a seat at the table to the decision makers. Its a role that can branch out into a CFO, President of the company, or even a top operational role since that requires someone to understand the cogs of a business."
— Source: r/FPandA (61 upvotes)
Most companies have accounting, which tells them what already happened. But they also need to know what's going to happen next quarter, next year, and what the financial impact will be if they launch a new product, enter a new market, or cut costs.
That's what FP&A does. It forecasts, plans, and analyzes. It turns data into decisions. It's the function that executives lean on when they need to understand the financial shape of the business and decide where to take it.
This guide covers what FP&A is, how it works, what the team does day-to-day, and how it's structured across different company sizes. If you're exploring the field or trying to understand what FP&A does at your company, read on.
What is FP&A?
The 50-word definition
FP&A (Financial Planning & Analysis) is the function that forecasts company finances, builds budgets, analyzes variances between plan and actual results, and provides business insights to help executives make strategic decisions. It is forward-looking, unlike accounting, which records what has already happened.
FP&A is the intersection of finance and business strategy. The team doesn't just report numbers; it interprets them, models scenarios, and answers questions like:
- What will revenue be next quarter? Next year?
- If we hire 50 more people, what's the impact on profitability?
- Should we cut marketing spend or grow it?
- Can we afford to enter a new channel or market?
- What happens to cash if we extend payment terms to customers?
- Are we on track to hit our financial goals?
These are the kinds of questions FP&A answers. Accounting tells the CEO what happened last month. FP&A tells them what will happen next quarter and what to do about it.
Core FP&A Processes
FP&A runs on a monthly cycle, and the work inside it falls into four core processes:
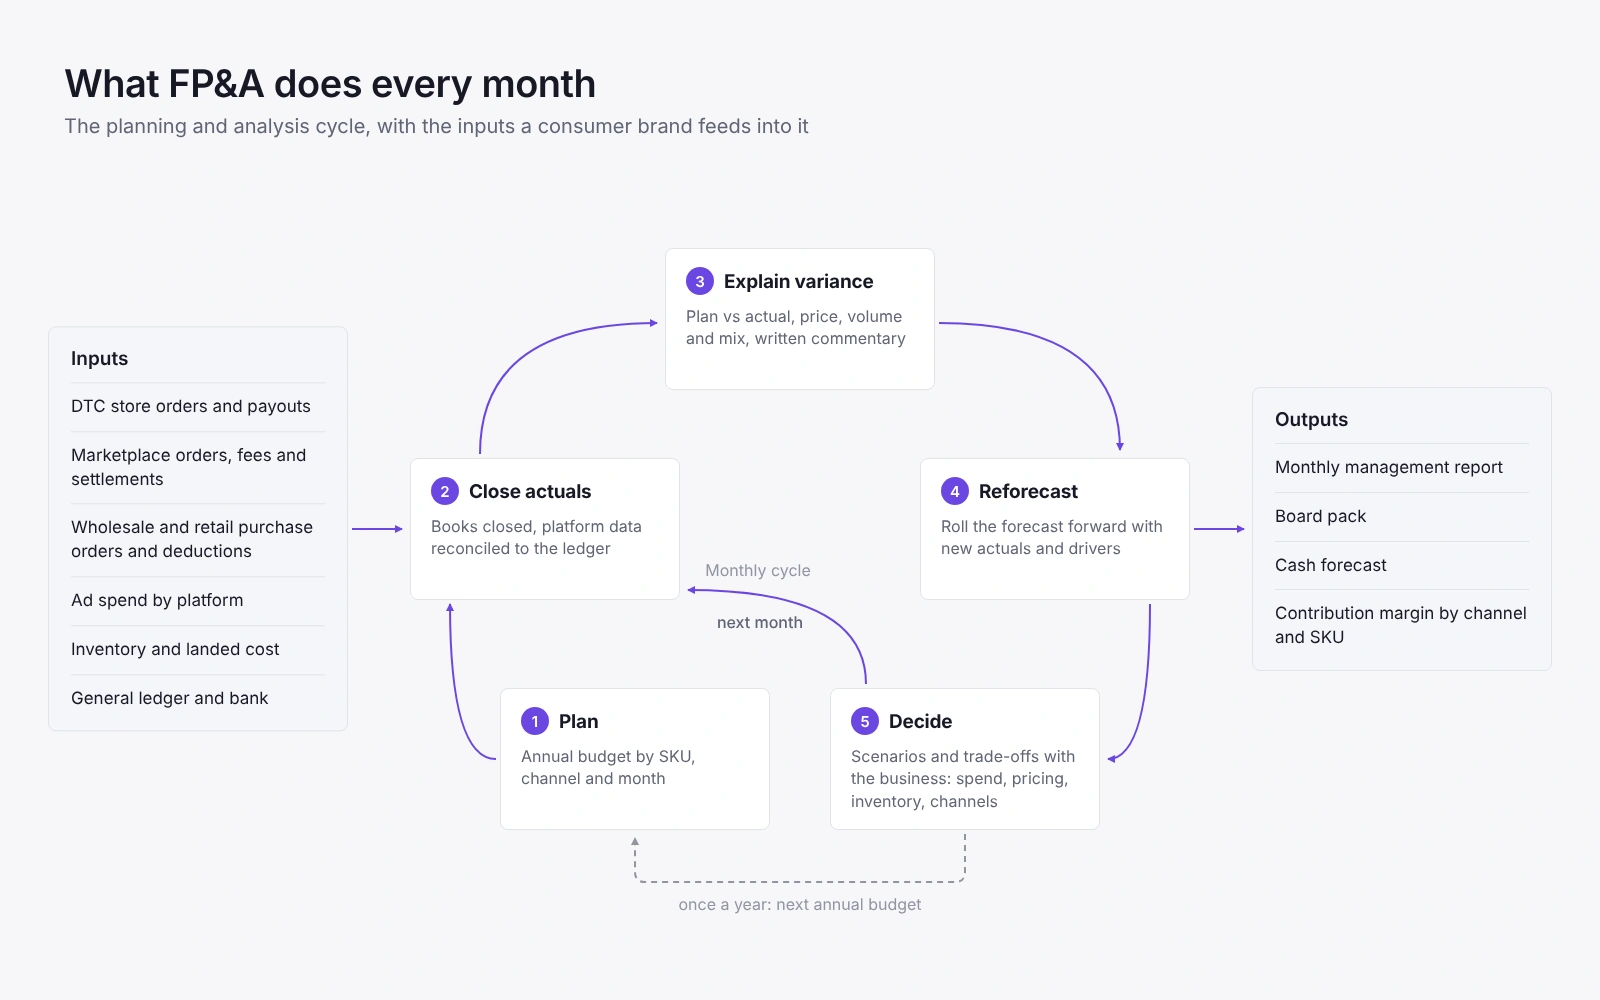
1. Annual Budgeting
Typically happens once a year (Sept-Dec for Jan-Dec fiscal year). FP&A works with every department to estimate revenue, headcount, marketing spend, and operating expenses for the next 12 months. This budget becomes the plan that the company will track actuals against all year.
- Top-down: finance sets overall financial targets, departments break it down
- Bottom-up: departments submit their plans, finance consolidates and reviews
- Hybrid: finance sets targets; departments plan; finance reviews and iterates
Budgeting is the most politically charged FP&A activity. Every department wants more resources. FP&A has to balance ambition with reality.
2. Rolling Forecasts (Monthly/Quarterly Updates)
While the annual budget stays fixed, forecasts update every month or quarter to reflect new information. If Q1 came in 15% higher than plan, FP&A updates the full-year forecast to reflect the new baseline.
Rolling forecasts are more useful than static budgets because the business changes: a new customer signs, a competitor launches, a recession hits. Forecasts adapt.
3. Variance Analysis and Commentary
Every month or quarter, FP&A compares actual results to plan (budget or forecast) and explains the differences. Why did revenue miss? Why was marketing spend higher than budgeted? This analysis goes to the board, investors, and executive team.
Good variance analysis isn't just "revenue was down 5%." It's "revenue was down 5% because Customer A delayed their purchase by one month (we expect it to close in Q2), and new-customer acquisition was flat due to a sales headcount gap we're now filling."
4. Business Partnering and Strategic Analysis
FP&A works closely with operations, sales, marketing, and product teams to understand the business drivers and provide analysis that supports decision-making. Examples vary by business:
- Pricing: "If we raise price on our hero SKU by 5%, what's the impact to margin and units sold?" (Product owner provides elasticity; FP&A models P&L impact)
- Channel expansion: "Should we add this SKU to Amazon? What are the net margins after fulfillment and referral fees?" (FP&A calculates contribution margin by channel)
- Marketing spend: "We're spending 20% of revenue on paid ads. Is that sustainable?" (FP&A models CAC, cohort LTV, and payback period by channel)
- Wholesale/retail entry: "A distributor wants to carry us on net-60 terms. What's the cash impact?" (FP&A models working capital, deductions, and seasonality)
- Inventory: "We're planning a Q4 promo. How much inventory do we need? What's the cash outlay?" (FP&A forecasts units and cash outflow by month)
This is where FP&A stops being administrative (pushing numbers around) and starts being strategic (influencing decisions). The analysis is only valuable if it ties to the business model.
Illustrative Example: Q1 Forecast and Variance
Here's what FP&A actually does, month by month:
Scenario: A $30M consumer brand with DTC, Amazon, and wholesale channels
| Line | January budget | January actual | Variance | Explanation |
|---|---|---|---|---|
| DTC revenue | $1,800K | $1,720K | -$80K (-4.4%) | Sessions ran 8% below plan after holiday promotions ended; conversion was on plan |
| Amazon revenue | $900K | $920K | +$20K (+2.2%) | A new Sponsored Products campaign lifted units about 5%, partly offset by a lower average price from coupons |
| Wholesale revenue | $600K | $585K | -$15K (-2.5%) | One retailer moved part of its order into February |
| Total revenue | $3,300K | $3,225K | -$75K (-2.3%) | |
| Gross profit (DTC 60%, Amazon 40%, wholesale 40%) | $1,680K (50.9%) | $1,634K (50.7%) | -$46K | Lower DTC volume at the highest margin; mix shifted slightly toward Amazon |
| Paid media (DTC and Amazon) | $450K | $470K | +$20K | Amazon ad spend scaled with the new campaign |
| Fixed operating expenses | $900K | $880K | -$20K | A planned hire started late |
| Operating income | $330K | $284K | -$46K (-13.9%) | Most of the miss traces to DTC traffic, not costs |
What FP&A did: Broke down each revenue line by channel and SKU. Investigated why DTC traffic missed (holiday hangover + organic decline). Confirmed Amazon's price elasticity was -1.2 and profitability was still positive at the lower price. Calculated cash impact: less COGS spend meant 3 extra weeks of runway. Recommended: shift budget to Amazon ads (highest ROI), hold DTC spend, test a clearance promo on slow SKUs.
This is the essence of FP&A: not just reporting what happened, but explaining why, and advising what to do next.
What FP&A Teams Do Day-to-Day
FP&A work is cyclical. It's never equally busy all year:
Quiet periods (weeks after close)
- Build analysis and ad-hoc models (scenario planning, initiative analysis)
- Partner with business leaders on strategy
- Improve models and processes
- Attend business meetings and present insights
Busy periods (close window: 3-5 days after month/quarter closes)
- Reconcile actual results to accounting close
- Run variance analysis: plan vs actual, and budget vs forecast
- Build the management report deck (P&L, KPIs, narrative)
- Prepare board pack (if quarter-end)
- Field questions from executives
A typical analyst spends time across several types of work:
- Modeling and Excel: building forecasts, pulling data from systems, running scenario analysis
- Business partner meetings: sales, operations, marketing leaders to understand drivers and refine forecasts
- Variance analysis and reporting: investigating why actuals diverged from plan, documenting narratives
- Ad-hoc analysis: answering CEO questions, evaluating new initiatives, modeling decisions
- Process and tool maintenance: keeping dashboards current, improving the data pipeline
The mix depends on where you are in the month. During close window (3-5 days after month-end), it's 80% reporting and variance. Between closes, it's 60% business partnering and analysis. As people move up to manager/director level, the balance shifts: less hands-on modeling, more team leadership and executive communication.
FP&A Team Structure by Company Size
Early-stage: $5-20M revenue
- Usually 0-2 FP&A people (often a fractional CFO or the founder doing it)
- Focus: cash flow forecast, monthly P&L, basic budget
- Tools: Excel, QuickBooks or Xero
- Scope: company-wide
Growth-stage: $20-100M revenue
- 2-5 FP&A people (1 manager, 2-4 analysts)
- Focus: detailed budget, rolling forecast, board pack, business partnering
- Tools: Excel, SQL, Power BI or Looker, maybe a planning tool
- Scope: company-wide or divisional
Enterprise: $100M+ revenue
- 5-30+ FP&A people, structured as: Corporate FP&A (company-wide), Divisional FP&A (by business line), Strategic Finance (M&A, large projects)
- Focus: complex forecasting, scenario modeling, capital allocation, investor relations, acquisition modeling
- Tools: Excel, SQL, dedicated planning tools (Anaplan, Cube, Vena), custom systems
- Scope: company-wide, divisional, by product/region
The progression is similar everywhere: analyst (2-3 years) -> senior analyst (2-3 years) -> manager (3-5 years) -> director (3-5 years) -> VP / CFO.
Key Skills and Tools
Technical skills
- Excel: Pivot tables, VLOOKUP, INDEX-MATCH, formulas, dashboard building. This is non-negotiable. Analysts spend much of their time in Excel.
- SQL: Increasingly important. Analysts need to pull data from databases, join tables, aggregate by business dimension. Not everyone needs expert SQL, but comfort with SELECT, WHERE, JOIN, and GROUP BY is standard.
- BI tools: Power BI, Looker, or Tableau for visualization. Usually used for dashboards and reporting, not deep analysis.
- Financial modeling: Building P&L, balance sheet, cash flow forecasts. Understanding links between statements is essential.
- Accounting fundamentals: Not a CPA-level deep dive, but understanding accruals, COGS, gross margin, OPEX, and how they flow to financial statements is required.
Soft skills
- Communication: Explaining complex financial concepts simply. A great FP&A analyst can tell a story with numbers.
- Business acumen: Understanding the business drivers. Why does revenue fluctuate? How do marketing campaigns impact sales? What's the relationship between headcount and productivity?
- Stakeholder management: Collecting inputs from departments, handling pushback, delivering bad news diplomatically.
- Problem-solving: Not every question has a clear answer. FP&A must make assumptions, test them, and iterate.
Tools by company size
| Size | Typical Stack | Consumer Brand Addition |
|---|---|---|
| $5-20M | Excel, QuickBooks/Xero, Google Sheets | Manual pulls from Shopify, Amazon Seller Central |
| $20-100M | Excel, SQL, Power BI/Looker, QuickBooks/Xero/NetSuite | Shopify, Amazon Ads, Meta Ads, basic data consolidation (often via Zapier or custom scripts) |
| $100M+ | Excel, SQL, dedicated planning tool (Anaplan, Cube, Vena), Power BI/Looker, NetSuite/Oracle/SAP | Full platform integration: Shopify, Amazon Seller Central, Amazon Ads, Google Ads, wholesale EDI, automated reconciliation |
What FP&A Practitioners Say
FP&A is one of the most discussed functions on Reddit because practitioners value the blend of finance and business strategy. Here's what the community highlights:
"It's where the business understands itself at the highest level. What we've done. What the result of that was. What might happen in the future."
— Source: r/FPandA (61 upvotes)
"FP&A bridges the gap of accounting being in the weeds and C-Suite charting a way through the forest. FP&A typically runs the budget, answers for variances MoM, QoQ, YoY, variance to plan. Big part of the budget is taking strategic initiatives from C-Suite, forecasting the dollar impact and implementing them into the budget process."
— Source: r/FPandA (402 upvotes)
The role attracts people who want impact beyond spreadsheets. FP&A analysts see the full business: revenue, costs, inventory, cash, strategy. That visibility and influence are why many accountants transition to FP&A, and why FP&A is a clear path to CFO.
For Consumer Brands: Unique Complexity
FP&A for omnichannel consumer brands (DTC + Amazon + wholesale/retail + quick commerce) has layers of complexity that generic FP&A guides don't address. Most FP&A resources assume one channel and one cost structure. That doesn't work here.
Multi-channel margin arithmetic
For example, take a product that sells for $100 on your site and costs $30 to make and land. On DTC, after about $10 of fulfillment and payment fees, you keep $60 (60%). On Amazon at the same price, a 15% referral fee plus FBA and storage fees can leave you about $40 (40%). Through wholesale you invoice the retailer perhaps $50, so you keep $20: 40% of the wholesale price, but a third of the DTC profit per unit. (Illustrative numbers; check Amazon's current fee schedule and your own costs.) FP&A must calculate contribution margin by channel and SKU. Revenue is not profit. Volume shift between channels drives margin swings.
Customer cohort economics and LTV
DTC revenue is driven by cohort-based LTV. A customer acquired in January for $30 CAC might generate $150 lifetime value if repeat rate is 35% and AOV stays at $75. FP&A forecasts cohorts (by acquisition month and channel), tracks retention curves, and calculates payback. If CAC spikes or repeat rate drops, the whole unit economics break.
Working capital and cash timing
Inventory sits in warehouses and on 3PLs. Amazon pays 14 days after shipment. Wholesale retailers pay in 60+ days. An Amazon referral fee or chargebacks hit cash immediately but revenue recognition lags. FP&A must forecast inventory aging by SKU, payout timing by channel, return rates, and working capital needs. At scale, this drives cash flow more than profit.
Platform data integration
Revenue comes from Shopify, Amazon Seller Central, Amazon Ads (for spend tracking), Meta Ads, Google Ads, Klaviyo (email revenue), and wholesale orders via EDI or email. Costs span COGS (landed cost including tariffs), fulfillment (3PL fees), platform fees, and ad spend. Each source has different timing, categorization, and accuracy. FP&A must pull, match, and reconcile these or work in data silos. Most FP&A teams at early-to-mid-stage consumer brands spend 40-50% of their time on data plumbing rather than analysis. That's the biggest bottleneck.
For consumer brands, FP&A is the bridge between operations (demand planning, inventory, supply chain, customer acquisition) and finance (cash, margin, profitability). The complexity isn't in the formulas; it's in the data integration and multi-dimensional analysis. When data plumbing is automated (platform-to-ledger reconciliation, revenue matching, cost allocation), FP&A can focus on the work that matters: forecasting, margins, and business decisions.
Getting Started with FP&A
FP&A is a broad function. Whether you're learning it as a new hire, transitioning from accounting, or building an FP&A function at your company, start with the fundamentals: annual budgeting, monthly variance analysis, and simple forecasting. Master Excel and SQL before adding tools.
The career path is clear: analyst to senior analyst to manager to director to CFO. The barrier to entry is lower than accounting (no CPA required) but the growth potential is higher: FP&A is one of the few finance functions that leads directly to the C-suite.
If you're at a consumer brand managing multiple channels and SKUs, FP&A becomes your center of gravity. It's where you reconcile revenue, understand margin by channel, forecast cash, and make decisions about which products and channels to double down on.
For consumer brands, FP&A is the engine of strategic decision-making.
If you're tired of data plumbing and want your FP&A team focused on analysis and business partnering, Niblin connects your DTC, Amazon, wholesale, and retail channels to a live FP&A model that calculates contribution margin by SKU and channel, forecasts cash, and generates board packs without manual reconciliation.
See how Niblin models it
Key Takeaways
- FP&A stands for Financial Planning & Analysis. It forecasts company finances, builds budgets, analyzes results, and supports executive decision-making.
- Core processes: annual budgeting, rolling forecasts, variance analysis, and business partnering.
- FP&A is forward-looking (what will happen), while accounting is backward-looking (what did happen).
- Day-to-day work is 40% Excel, 30% meetings, 20% analysis, 10% admin. Cyclical: busy during close window, quiet between closes.
- Team structure varies by company size: 0-2 FP&A at $5-20M, 2-5 at $20-100M, 5-30+ at $100M+.
- Core tools: Excel, SQL, Power BI/Looker, accounting system (QuickBooks/Xero/NetSuite).
- For consumer brands, FP&A manages multi-channel profitability, CAC/LTV cohorts, working capital, and data integration across DTC, Amazon, wholesale, and retail.
- FP&A is a direct pathway to CFO: analyst > senior analyst > manager > director > VP > CFO.
Frequently Asked Questions
What is the main difference between FP&A and accounting?
Accounting is backward-looking: it records transactions, reconciles accounts, and produces financial statements reflecting what has already happened. FP&A is forward-looking: it forecasts what will happen financially, builds plans to achieve goals, and helps executives make decisions. Accounting is about accuracy; FP&A is about insight and strategy.
What does a typical FP&A analyst do?
An analyst builds financial models, gathers data from various sources, runs variance analysis comparing actuals to plan, builds reports and decks for management, and supports ad-hoc analysis requests. The mix changes depending on the phase of the budget/forecast cycle. During month-end close, it's 80% variance and reporting. Between closes, it's 60% ad-hoc analysis and business partnering.
Do you need an accounting background for FP&A?
It helps but is not required. Accounting gives you a foundation in financial statements and GL structure. But many successful FP&A professionals come from economics, business, or even non-finance backgrounds. What matters is the ability to learn financial concepts, think logically, and communicate clearly. Most FP&A training happens on the job.
Is FP&A a good career path?
Yes, it's one of the strongest pathways to CFO. FP&A roles offer exposure to the entire business (you work with every department), visibility to senior management, and strategic influence. Pay is competitive, work-life balance is better than accounting or investment banking, and exit opportunities (PE, startups, operations) are strong.
What tools should I learn for FP&A?
Start with Excel (it's non-negotiable) and basic SQL. Learn the ERP system at your company (QuickBooks, NetSuite, Xero). If the company uses Power BI or Looker, learn the basics. Most other FP&A tools (Anaplan, Cube) are nice-to-have but not essential early in your career. Excel + SQL + BI basics will get you hired and productive.
How long does it take to become proficient in FP&A?
You can become productive (able to run variance, build a simple forecast) in 3-6 months. To become proficient (running a budget cycle, leading projects, giving business insights) typically takes 1-2 years. To become expert (designing the FP&A function, large scenario models, strategic influence) usually takes 4-5 years. Every person and company is different.