
FP&A Blog
Margins, cash, forecasting and close for brands selling DTC, on marketplaces and through retail.
FP&A glossary: definitions A to ZStart here

FP&A fundamentals
What is FP&A? Definition, Responsibilities, and Day-to-Day Work
24 min read- Financial Model Best Practices: Structure, Formulas, Error Checks and Version Control
- Ecommerce Brand Valuation: SDE vs EBITDA Multiples and Quality of Earnings
- Cash vs Accrual Accounting: IRS Rules and Consumer Brand Examples
- NPV, IRR, and WACC: Capital Budgeting Decisions for Consumer Brands
- Adjusted EBITDA: Add-Backs, Auditor Skepticism, and How to Present It
- How to Run Your Annual Budget Process: Timeline, Methods, and Sign-Off
- Budget vs Forecast vs Plan: Definitions, Differences, and How to Use Each
- Cost Allocation Methods: Headcount, Revenue, and Activity-Based Models
- Forecast Accuracy: Metrics, Benchmarks, and How to Improve
- FP&A Business Partnering: Influence Without Authority and Difficult Stakeholders
- FP&A Career Path: From Analyst to CFO, Timeline, and Skills to Master
- FP&A Interview Questions: Behavioral, Technical, and Case Studies with Answers
- FP&A KPIs: Key Metrics for Business Performance and Team Measurement
- FP&A vs Accounting: Differences, Pay, Career Path, and Work-Life Balance
- Headcount Planning: Attrition, Backfills, Fully Loaded Cost, and Payroll Reconciliation
- OpEx vs CapEx: Definitions, Accounting Treatment, and Cash Forecasting
- Scenario and Sensitivity Analysis: Base, Upside, Downside Cases
- Three-Statement Financial Model: Building and Linking Income Statement, Balance Sheet, and Cash Flow
- Zero-Based Budgeting: Definition, When It Works, and Why Most Companies Don't Fully Adopt It

Margins & unit economics
Contribution Margin for Consumer Brands: CM1/CM2/CM3 by Channel
18 min read- Unit Economics for Consumer Brands: CAC, LTV, AOV, and Contribution Per Order
- CAC and LTV Payback Period for Consumer Brands: LTV:CAC Ratio Calculator
- Break-Even Analysis for Consumer Brands: Units and Revenue Calculator
- Average Order Value (AOV) for Consumer Brands: Calculation and Optimization
- Markup vs. Margin: Formulas, Examples & Conversion Table for Consumer Brands
- Customer Retention and Cohort Analysis: Repeat Rate and Churn by Month
- Price-Volume-Mix Analysis for Consumer Brands: Excel Template & Examples
- MER vs ROAS: Why Platform ROAS is a Lie (and What To Track Instead)
- Trade Spend & Gross-to-Net Waterfall: CPG Channel Economics 2026
- What is a Good Profit Margin for Consumer Brands? Industry Benchmarks 2026
- Landed Cost for Ecommerce: How to Calculate True COGS with Tariffs & Freight
- Wholesale vs DTC Margins: Channel Economics for Consumer Brands

Cash flow
13-Week Cash Flow Forecast for Consumer Brands: Structure, Build, and Payout Lag
16 min read- Cash Runway and Burn Rate: Definition, Formula & Forecast for Consumer Brands
- Free Cash Flow for Consumer Brands: Formula, Bridge from Net Income & Examples
- Business Financing for Consumer Brands: Options, Covenants & When to Raise
- Cash Conversion Cycle for Consumer Brands: DTC vs Wholesale vs Amazon
- Payment Processor Reserves and Payout Holds: How Shopify, Stripe, and PayPal Impact Cash
- Net 60 Payment Terms for Wholesale: Managing Cash Flow and Payment Timing
- Profitable But No Cash: Why It Happens and How to Fix It

Planning & forecasting
Budget vs Actual Variance: How to Run Real Variance Analysis (2026)
16 min read- Budgeting Methods Explained: Static, Incremental, Flexible, Activity-Based and Zero-Based
- KPI Tree: How to Build a Driver Tree That Links Daily Metrics to Revenue and Profit
- Planning Assumptions: How to Document and Defend Budget Assumptions
- Strategic Planning vs Budgeting: How a Long-Range Plan Becomes Next Year's Budget
- Rolling & Driver-Based Forecasting: The Framework That Adapts to Change
- How to Raise Prices Due to Tariffs: Pass-Through Strategy by Channel
- Tariff Scenario Planning: Build Your Financial Models for Change

Inventory
Inventory and Working Capital for Consumer Brands: Cash Conversion Cycle
14 min read- Reorder Point and Safety Stock: Inventory Formulas for Consumer Brands
- Demand Planning for Consumer Brands: From Forecast to PO
- Inventory Write-Down: Valuation and Reserves Under US GAAP
- GMROI (Gross Margin Return on Investment) for Consumer Brands: SKU & Channel Analysis
- Sell-Through Rate for Consumer Brands: DTC vs Retail vs Wholesale
- SKU Rationalization and Dead Stock: How to Identify and Clear Unprofitable Inventory

Finance operations
Month-End Close for Ecommerce Brands: Shopify, Amazon, Wholesale Reconciliation
11 min read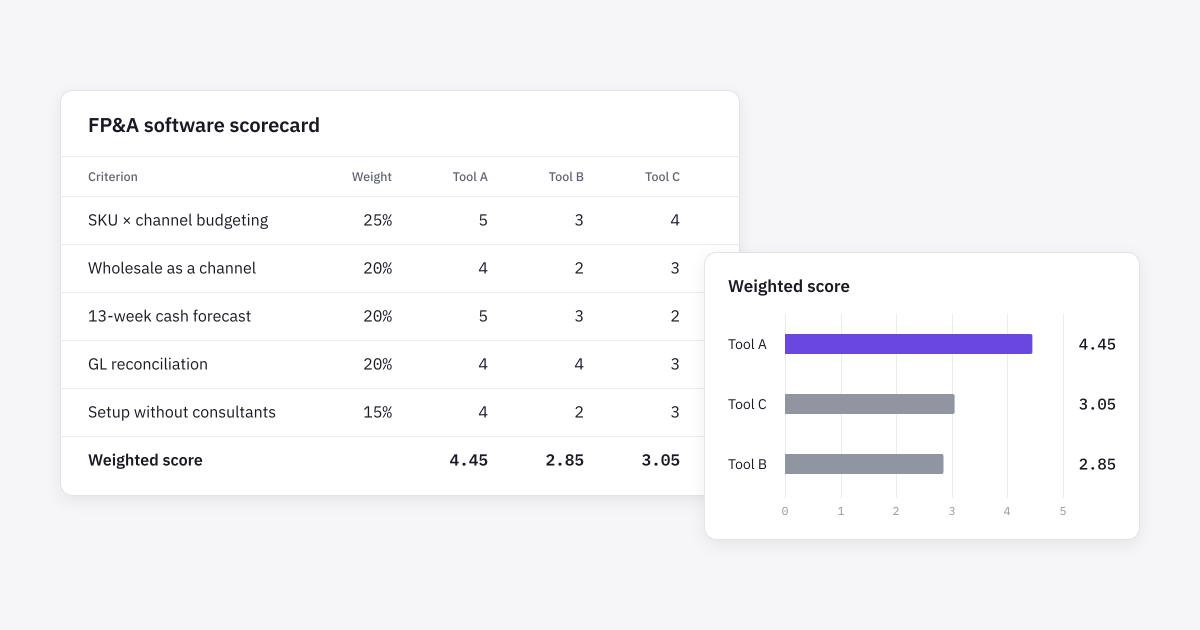
FP&A tools & team
Best FP&A Software for Consumer Brands (2026): Feature Comparison & Buyer's Guide
12 min read- AI in Finance and FP&A: What Actually Works (And What's Hype)
- Excel vs FP&A Software for CPG Brands: When the Spreadsheet Breaks
- Hiring Your First FP&A Analyst: Job Description, First-90-Days Plan & Team Structure
- Fractional CFO vs FP&A Software: Which Fits Your $5-20M Consumer Brand?
- NetSuite Alternatives: Sage Intacct, Business Central, and When NOT to Switch
- QuickBooks Alternatives for Scaling Omnichannel Brands
Featured Articles
Budgeting Methods Explained: Static, Incremental, Flexible, Activity-Based and Zero-Based
Compare the five main budgeting methods, when each one fits a consumer brand, and how to build a flexible budget that separates volume from performance in your variance analysis.
KPI Tree: How to Build a Driver Tree That Links Daily Metrics to Revenue and Profit
A KPI tree breaks a financial goal into the operating drivers that produce it. Learn how to build one for a consumer brand, assign owners, and use it to plan and explain variances.
Planning Assumptions: How to Document and Defend Budget Assumptions
Every budget rests on assumptions. Learn how to separate facts from assumptions and judgments, build an assumption register with owners and evidence, rank assumptions by sensitivity, and treat temporary vs recurring drivers in a reforecast.
All Articles
Strategic Planning vs Budgeting: How a Long-Range Plan Becomes Next Year's Budget
A strategic plan sets where the business is going over three to five years; the budget commits next year's resources. Learn how strategy cascades into financial targets and owned measures, how to build a long-range plan, and how to reconcile it with the annual budget.
Read MoreFinancial Model Best Practices: Structure, Formulas, Error Checks and Version Control
The habits that make a financial model easy to trust and hard to break: separating inputs from calculations, avoiding hard-codes, building error checks, and controlling versions. With consumer-brand examples.
Read MoreUnit Economics for Consumer Brands: CAC, LTV, AOV, and Contribution Per Order
Unit economics measures the profitability of a single customer or order. Learn CAC, LTV (on contribution margin basis), AOV, CAC payback, and contribution per order. Includes calculators and worked examples.
Read MoreCAC and LTV Payback Period for Consumer Brands: LTV:CAC Ratio Calculator
CAC payback is how long it takes a customer's contribution margin to repay the acquisition cost. Learn the LTV:CAC ratio, the cohort payback method, and worked examples for DTC, subscription and Amazon.
Read MoreBreak-Even Analysis for Consumer Brands: Units and Revenue Calculator
Break-even analysis shows how many units or dollars of revenue you need to reach profitability. Learn the formula, how to calculate break-even by channel, and how to use it for pricing and launch decisions.
Read MoreAverage Order Value (AOV) for Consumer Brands: Calculation and Optimization
Average Order Value (AOV) is revenue per order. Learn how to calculate AOV, optimize it through bundling and upsell, and avoid the trap of rising AOV with falling contribution margin.
Read MoreMarkup vs. Margin: Formulas, Examples & Conversion Table for Consumer Brands
Understand markup (price - cost) / cost and margin (price - cost) / price. See worked examples, conversion table, and why getting these right matters for pricing strategy.
Read MoreCustomer Retention and Cohort Analysis: Repeat Rate and Churn by Month
Master cohort analysis: measure repeat rate, churn, and customer lifetime value by acquisition month. Includes cohort tables, worked examples, and metrics to track for DTC and subscription brands.
Read MoreCash Runway and Burn Rate: Definition, Formula & Forecast for Consumer Brands
Burn rate measures how fast you spend cash relative to revenue. Learn to calculate monthly burn, forecast runway, and model cash scenarios for DTC brands, Amazon sellers, and omnichannel businesses.
Read MoreFree Cash Flow for Consumer Brands: Formula, Bridge from Net Income & Examples
Free cash flow is operating cash flow minus capital expenditures. Learn to calculate FCF from net income, understand the bridge, and see why FCF matters more than EBITDA for consumer brands.
Read MoreBusiness Financing for Consumer Brands: Options, Covenants & When to Raise
Explore financing options for DTC and omnichannel brands: inventory/PO financing, lines of credit, revenue-based financing, factoring, SBA loans, and key covenants to understand.
Read MoreReorder Point and Safety Stock: Inventory Formulas for Consumer Brands
Learn how to calculate reorder point (ROP), safety stock, Economic Order Quantity (EOQ), and Minimum Order Quantity (MOQ) for omnichannel brands. Includes formulas, worked examples, and how to balance stockouts against cash tie-up.
Read MoreDemand Planning for Consumer Brands: From Forecast to PO
Master demand planning for omnichannel brands: forecast demand by channel, incorporate seasonality and promotions, and align orders with cash flow. Includes formulas, a monthly planning template, and worked examples.
Read MoreInventory Write-Down: Valuation and Reserves Under US GAAP
Learn inventory write-downs under ASC 330, including lower of cost and net realizable value, valuation reserves, journal entries, and the effect on COGS, margin, and tax. Includes worked examples and reserve calculations.
Read MoreEcommerce Brand Valuation: SDE vs EBITDA Multiples and Quality of Earnings
Understand how ecommerce brands are valued using SDE and EBITDA multiples. Learn what drives valuation multiples: growth, margins, customer concentration, channel mix, and quality of earnings. Includes worked examples and fair valuation factors.
Read MoreCash vs Accrual Accounting: IRS Rules and Consumer Brand Examples
IRS rules on cash vs accrual accounting for small businesses. Learn who qualifies for the cash method under the IRS gross receipts test, and side-by-side P&L examples showing how each method affects brand profitability reporting.
Read MoreNPV, IRR, and WACC: Capital Budgeting Decisions for Consumer Brands
Learn Net Present Value (NPV), Internal Rate of Return (IRR), and Weighted Average Cost of Capital (WACC) with a worked example of a brand deciding between capex (warehouse) vs 3PL. Includes cash flow tables and discount rate calculations.
Read MoreAdjusted EBITDA: Add-Backs, Auditor Skepticism, and How to Present It
Understand adjusted EBITDA, common add-backs, why auditors and investors are skeptical, and how consumer brands should present adjusted metrics.
Read MoreHow to Run Your Annual Budget Process: Timeline, Methods, and Sign-Off
Learn how to run an annual budget process from start to finish: including budget calendar, bottom-up vs top-down methods, sandbagging risk, board sign-off, and common pitfalls to avoid.
Read MoreBudget vs Forecast vs Plan: Definitions, Differences, and How to Use Each
Budget, forecast, and plan are often confused. Learn what each means, how they differ, when to use each one, and how to build a process that uses all three effectively.
Read MoreCost Allocation Methods: Headcount, Revenue, and Activity-Based Models
Learn cost allocation methods for shared costs: headcount-based, revenue-driven, and activity-based. Includes allocation keys, common pitfalls, and how consumer brands allocate shared fulfillment and marketing costs across channels.
Read MoreForecast Accuracy: Metrics, Benchmarks, and How to Improve
How to measure forecast accuracy with MAPE and bias analysis. What "good" looks like, industry benchmarks from real FP&A teams, and proven methods to improve forecast quality.
Read MoreFP&A Business Partnering: Influence Without Authority and Difficult Stakeholders
Learn what FP&A business partnering means: building relationships with business leaders, influencing decisions without authority, handling budget overruns, and managing stakeholders who ignore the budget.
Read MoreFP&A Career Path: From Analyst to CFO, Timeline, and Skills to Master
FP&A is one of the fastest career paths to CFO. Learn the analyst-to-director-to-CFO progression, skills at each level, time to promotion, exit opportunities, and what separates high-performers from average analysts.
Read MoreFP&A Interview Questions: Behavioral, Technical, and Case Studies with Answers
Ace your FP&A interview. Learn the most common questions (why FP&A, tell me about a time, technical modeling), how to structure answers, and common mistakes. Includes sample answers and frameworks.
Read MoreFP&A KPIs: Key Metrics for Business Performance and Team Measurement
FP&A KPIs for business operations and for measuring FP&A team performance. How to choose the right KPIs, align them with strategy, and track them in dashboards.
Read MoreFP&A vs Accounting: Differences, Pay, Career Path, and Work-Life Balance
What's the difference between FP&A and accounting? Compare work focus, daily tasks, career trajectory, pay, and work-life balance. Why accountants switch to FP&A and whether it's the right move for you.
Read MoreHeadcount Planning: Attrition, Backfills, Fully Loaded Cost, and Payroll Reconciliation
Learn how to forecast headcount with attrition and backfills. Includes fully loaded cost calculations, payroll reconciliation, and how to model headcount accurately.
Read MoreOpEx vs CapEx: Definitions, Accounting Treatment, and Cash Forecasting
Learn the difference between operating expenses and capital expenditures: definitions, accounting treatment, budgeting strategies, CapEx cash forecasting, and rent vs. buy decisions.
Read MoreScenario and Sensitivity Analysis: Base, Upside, Downside Cases
Difference between scenario analysis and sensitivity analysis. How to build data tables, base/upside/downside cases, and use them for decision-making and risk management.
Read MoreThree-Statement Financial Model: Building and Linking Income Statement, Balance Sheet, and Cash Flow
How to build a three-statement financial model: income statement, balance sheet, and cash flow statement. Includes the correct build order, common balancing errors, linkages, and worked examples.
Read MoreWhat is FP&A? Definition, Responsibilities, and Day-to-Day Work
FP&A (Financial Planning & Analysis) forecasts company finances, budgets resources, and helps executives make strategic decisions. Learn what FP&A teams do, core processes, tools, team structure, and how it differs from accounting.
Read MoreZero-Based Budgeting: Definition, When It Works, and Why Most Companies Don't Fully Adopt It
Zero-based budgeting (ZBB) starts from zero and requires justifying every expense. Learn when it works, why most companies do it only once, and how to use it effectively.
Read MoreContribution Margin for Consumer Brands: CM1/CM2/CM3 by Channel
Contribution margin measures what's left after variable costs: the cash each sale contributes to fixed costs and profit. Learn CM1, CM2, CM3 by channel: DTC, Amazon, and wholesale with worked examples and a calculator.
Read MoreBudget vs Actual Variance: How to Run Real Variance Analysis (2026)
Budget vs actual variance analysis is your monthly test of whether your financial plan matches reality. Learn the framework, how to run it in QuickBooks/Xero/NetSuite, and how to write variance commentary that tells a story.
Read More13-Week Cash Flow Forecast for Consumer Brands: Structure, Build, and Payout Lag
Build a 13-week rolling cash forecast that absorbs Shopify/Amazon payouts, wholesale AR with deductions, inventory POs, and 3PL deposits. Step-by-step for omnichannel brands.
Read MoreRolling & Driver-Based Forecasting: The Framework That Adapts to Change
Rolling forecasts re-cut monthly with fresh data; driver-based forecasts tie outcomes to measurable inputs like traffic, CVR, and AOV. Learn how to build both for DTC, Amazon, and wholesale channels.
Read MorePrice-Volume-Mix Analysis for Consumer Brands: Excel Template & Examples
Price-Volume-Mix (PVM) analysis breaks variance into components: price changes, volume changes, and product mix. Learn the formula, build a working model, and write variance commentary.
Read MoreBest FP&A Software for Consumer Brands (2026): Feature Comparison & Buyer's Guide
Compare FP&A software built for consumer brands: Niblin, Drivepoint, Iris Finance, Cube, Abacum, Datarails, Pigment, and Planful. Find which tools fit $5-100M brands with omnichannel operations.
Read MoreMER vs ROAS: Why Platform ROAS is a Lie (and What To Track Instead)
Platform ROAS and Marketing Efficiency Ratio (MER) are NOT the same. Learn the difference, why ROAS hides profitability, and how to calculate true marketing efficiency tied to contribution margin.
Read MoreTrade Spend & Gross-to-Net Waterfall: CPG Channel Economics 2026
Understand the complete gross-to-net waterfall for consumer brands selling through retail. Track trade spend, deductions, slotting fees, settlement lag, and budgeting ROI by retailer.
Read MoreAI in Finance and FP&A: What Actually Works (And What's Hype)
An honest look at AI for financial planning: variance narratives, source mapping, reconciliation. Learn what delivers ROI vs. what sounds good in a pitch deck.
Read MoreBoard & Investor Reporting for Consumer Brands: Template & KPIs
A monthly board pack for a $5-100M consumer brand: revenue by channel, CM by channel, 13-week cash, inventory weeks, MER. Narrative template and variance explanation framework included.
Read MoreCash Conversion Cycle for Consumer Brands: DTC vs Wholesale vs Amazon
Cash conversion cycle (DIO + DSO - DPO) measures how long cash stays tied up in working capital. Learn the formula, calculate it by channel, and understand why DTC, Amazon FBA, and wholesale have dramatically different CCC timelines.
Read MoreExcel vs FP&A Software for CPG Brands: When the Spreadsheet Breaks
Excel works until it doesn't. For consumer brands with 500+ SKUs and 8+ channels, Excel becomes unmaintainable. Compare when spreadsheets still work vs why FP&A software becomes essential.
Read MoreHiring Your First FP&A Analyst: Job Description, First-90-Days Plan & Team Structure
A ready-to-use FP&A analyst job description for $10-30M consumer brands. Includes first-90-days plan, compensation benchmarks, and how to make your hire productive sooner with the right tools.
Read MoreFractional CFO vs FP&A Software: Which Fits Your $5-20M Consumer Brand?
Fractional CFOs and FP&A software aren't competitors: they're partners. Learn when to hire each, how to vet a fractional CFO without getting scammed, and the combo that works best for $5-20M brands.
Read MoreGMROI (Gross Margin Return on Investment) for Consumer Brands: SKU & Channel Analysis
GMROI measures gross margin dollars earned per dollar of inventory invested. Learn the formula, calculate GMROI by SKU and channel, and use it for inventory decisions and SKU rationalization.
Read MoreWhat is a Good Profit Margin for Consumer Brands? Industry Benchmarks 2026
Discover typical profit margin ranges for consumer brands by category: beauty, apparel, food & beverage, supplements, DTC, and wholesale. Includes gross, contribution, and net margin benchmarks.
Read MoreInventory and Working Capital for Consumer Brands: Cash Conversion Cycle
Inventory is cash on the shelf. Learn how to forecast inventory, minimize dead stock, manage lead times (60-90 days from China), and calculate Days Inventory Outstanding (DIO) for omnichannel brands.
Read MoreLanded Cost for Ecommerce: How to Calculate True COGS with Tariffs & Freight
Landed cost is your true COGS: product cost + inbound freight + duties + tariffs + packaging. Learn to calculate, account for tariff changes, and reconcile to contribution margin.
Read MoreMonth-End Close for Ecommerce Brands: Shopify, Amazon, Wholesale Reconciliation
A practical month-end close checklist for consumer brands: reconcile platform payouts to ledger, account for fees/refunds/reserves, true-up inventory and COGS, accrue wholesale deductions. With a day-by-day close calendar.
Read MoreMulti-Entity Financial Consolidation for Omnichannel Consumer Brands
Handle US + international entities, intercompany eliminations, and FX with QuickBooks, Xero, or NetSuite. Learn the consolidation process and best-practice tools.
Read MoreNetSuite Alternatives: Sage Intacct, Business Central, and When NOT to Switch
Evaluating NetSuite? Compare Sage Intacct, Microsoft Business Central, Acumatica, and upgraded accounting stacks. Learn implementation pain points and total cost of ownership.
Read MorePayment Processor Reserves and Payout Holds: How Shopify, Stripe, and PayPal Impact Cash
Why Shopify Payments, Stripe, and PayPal hold funds or delay payouts. How reserves hit cash flow, how to forecast them, and tactics to reduce hold amounts.
Read MoreNet 60 Payment Terms for Wholesale: Managing Cash Flow and Payment Timing
How consumer brands handle net 30/60/90 payment terms with retail partners. Understand the cash gap, negotiate early-pay discounts, and model payment timing in a 13-week forecast.
Read MoreProfitable But No Cash: Why It Happens and How to Fix It
You're profitable on paper but cash-flow negative. Learn why: inventory lag, AR deductions, debt principal, owner draws, and platform reserves. Plus the cash conversion cycle fix.
Read MoreQuickBooks Alternatives for Scaling Omnichannel Brands
Outgrowing QuickBooks Online? Compare Xero, NetSuite, Zoho Books, Sage Intacct, and FreshBooks. Learn when to stay on QBO + tools on top versus switching completely.
Read MoreSell-Through Rate for Consumer Brands: DTC vs Retail vs Wholesale
Sell-through rate measures units sold divided by units received (sell-in). Learn the formula, calculate it by channel, and understand DTC vs retail sell-through, reorder signals, and retailer conversations.
Read MoreSKU Rationalization and Dead Stock: How to Identify and Clear Unprofitable Inventory
How to cut dead SKUs using contribution margin and turn analysis. Learn clearance tactics, mystery boxes, bundles, liquidators, donation write-offs, and the cash math. Plus how to prevent it next season.
Read MoreHow to Raise Prices Due to Tariffs: Pass-Through Strategy by Channel
When tariffs increase COGS, not all channels absorb the cost the same way. Learn which SKUs to raise on DTC, Amazon, and wholesale; how to communicate increases; price-pack tactics; and modeling elasticity.
Read MoreTariff Scenario Planning: Build Your Financial Models for Change
Tariffs, price increases, new channels: these force scenarios. Learn to model them: tariff impact on margins, price-pack decisions, channel entry/exit, competitor moves. Real framework for consumer brands.
Read MoreWholesale vs DTC Margins: Channel Economics for Consumer Brands
Understand the real margin differences between wholesale, retail, distributor, and DTC channels. Compare costs, keystone pricing, and when wholesale is actually profitable.
Read MoreThe Shopify-Meta Reconciliation: Finding Every Dollar of Lost Revenue
Meta says you made $42K. Shopify says $50K. Neither is wrong - they're counting differently. This forensic guide breaks down every source of discrepancy and shows you how to reconcile the numbers so you can make real decisions.
Read MoreAdvantage+ Is Sending You Bot Traffic: How to Prove It With Data
Add-to-carts are spiking but sales are flat. Your conversion campaign is getting clicks from accounts that never buy. Here's how to detect bot traffic in Advantage+ campaigns and what to do about it.
Read MoreDoes Meta Throttle Your Best Days? The Data Behind Performance Normalization
Crush it Monday, crash Tuesday. Every time you hit 4x ROAS, the next day tanks. Advertisers suspect Meta normalizes performance back to your account average. Here's what the data actually shows.
Read MoreMeta's Andromeda Algorithm: What Changed and Why Your Campaigns Are Unstable
Meta's Andromeda AI update is causing widespread campaign instability. Performance was stable during the code freeze, then broke again. Here's what changed, what it means for your ads, and how to adapt.
Read MoreKlaviyo Says It Drove the Sale. Meta Says It Drove the Sale. Here's Who's Lying.
Your email platform claims 40% of revenue. Your ad platform claims 60%. That's 100% of revenue accounted for - except your total is only 100%. This guide shows how to resolve the attribution conflict and find the truth.
Read MoreCreative Fatigue vs Audience Fatigue: A Data Framework for Telling Them Apart
Your ROAS dropped. Is it the creative dying or the audience exhausted? Different problem, different fix. This framework uses hook rate, hold rate, frequency, and CTR trends to diagnose the real cause.
Read MoreThe ASC Budget Leak: How Much of Your Budget Meta Spends on Existing Customers
Advantage+ Shopping Campaigns look efficient until you realize 40-60% of your budget is going to people who already bought from you. Here's how to measure the leak, cap it, and redirect spend to new customers.
Read MoreMeta to Amazon: The $50K Attribution Blind Spot No One Talks About
Running Meta ads to your Amazon listings? Meta can't fire a pixel on Amazon. Your algorithm can't optimize. You're flying blind on what could be your highest-spend channel. Here's how to measure what's actually working.
Read MoreThe Meta Dependency Audit: How Exposed Is Your Business?
If Meta shut down your ad account tomorrow, what percentage of your revenue disappears? If the answer makes you uncomfortable, you need a dependency audit. This guide shows you how to measure and reduce your platform risk.
Read MoreYour CAPI Event Match Quality Is Stuck at 4/10. Here's What's Leaking.
Low Event Match Quality means Meta can't match your server events to real users. Your optimization suffers, your attribution gaps widen, and you're paying for data Meta can't use. Here's how to diagnose and fix it.
Read MoreShopify Plus Analytics: The Complete Guide for $5M-20M Brands (2026)
Everything $5M-20M Shopify Plus brands need to know about native analytics - what works, what's broken, what you need third-party tools for, and how to build a real analytics stack.
Read MoreShopifyQL Notebooks: A Practical Guide (With Real Examples)
How to use ShopifyQL Notebooks on Shopify Plus - real query examples, what you can and can't do, performance tips, and when to use alternatives.
Read MoreShopify Plus vs Advanced: Is the Analytics Upgrade Worth $2,000/Month?
A direct comparison of analytics features between Shopify Advanced ($399/mo) and Plus ($2,300+/mo). What you actually get, what you don't, and whether the analytics alone justify the upgrade.
Read MoreShopify Cohort Analysis: How to Read Retention Data (and Actually Use It)
How to use Shopify's cohort analysis to understand customer retention. How to read cohort tables, spot problems, benchmark your numbers, and take action.
Read MoreAutomating Shopify Analytics with Flow + ShopifyQL: Practical Guide
How to use Shopify Flow's "Get Analytics Data" action to automate reports, set up alerts, and trigger actions based on your store data - with real workflow examples.
Read MoreMulti-Store Reporting on Shopify Plus: What Works and What Doesn't (2026)
Honest guide to Shopify Plus multi-store analytics - what Organization Analytics actually does, the multi-currency nightmare, and practical solutions that don't require a data warehouse.
Read MoreShopify Plus B2B Analytics: The KPIs and Reports That Actually Matter
What Shopify Plus B2B reporting can and can't do. The wholesale KPIs you should track, how to build B2B-specific reports, and where native analytics fall short.
Read MoreShopify Markets Analytics: How to Track International Performance by Region
How to use Shopify Markets reporting to track sales, conversion rates, and AOV by country. Plus the gaps - tax compliance, currency impact, and market attribution.
Read MoreShopify Analytics Dashboard: The Complete Guide for 2026
Everything you need to know about Shopify analytics dashboards — what they are, how to access them, key metrics to track, limitations of native analytics, and the best third-party tools for brands that have outgrown Shopify reports.
Read More12 Best E-commerce Data Tracking Tools in 2026 (Attribution & Analytics)
Compare the best e-commerce data tracking tools for 2026. From attribution to profit tracking, find the right tool to track sales, ads, and customer data across channels.
Read MoreHow to Diagnose Low ROAS on Meta Ads: A Step-by-Step Field Guide
Your ROAS dropped 30% and you don't know why. This systematic 60-minute framework helps you diagnose the root cause—no guesswork, just math and logic.
Read MoreHow to Fix Creative Fatigue on Meta Ads (7 Proven Strategies)
Your Meta ad CTR is dropping. Learn how to diagnose creative fatigue and refresh your ads with 7 proven strategies that restore performance.
Read MoreMeta Ads Audience Expansion: When and How to Scale Targeting
Your Meta ad audience is exhausted. Learn when to expand, how to test new audiences without tanking performance, and proven expansion strategies.
Read MoreLanding Page Optimization for Paid Ad Traffic (9 Tactics That Work)
Your Meta ads get clicks but no conversions. Learn 9 proven landing page optimization tactics to boost CVR and improve ROAS.
Read MoreHow to Reduce CPC on Facebook Ads (8 Proven Tactics)
Your Facebook ad CPC is too high. Learn 8 proven tactics to lower cost per click and improve ad efficiency without killing performance.
Read MoreMeta Ads Tracking & Attribution Issues: Complete Troubleshooting Guide
Your Meta pixel isn't firing correctly or purchases aren't being tracked. Fix iOS 14+ tracking issues, CAPI setup, and attribution problems.
Read MoreHow to Increase AOV (Average Order Value): 11 Proven Tactics
Your Meta ads drive sales but order values are low. Learn 11 proven tactics to increase average order value without changing your ads.
Read MoreMeta Ads Learning Phase: Complete Guide (What to Do & What to Avoid)
Your Meta ad performance is unstable during learning phase. Learn how long it lasts, how to avoid resets, and when to make changes.
Read MoreSeasonal ROAS Fluctuations: What's Normal vs. What's a Problem
Your ROAS dropped after Black Friday or during summer. Learn what seasonal fluctuations are normal and when to actually diagnose a problem.
Read More10 Best Ecommerce Analytics Dashboards in 2026
Compare the top ecommerce analytics dashboards for Shopify and Amazon sellers. Find the right tool to unify your sales data and track performance across channels.
Read More8 Best Marketing Attribution Software for Ecommerce in 2026
Compare top marketing attribution software for ecommerce. Understand which ads drive sales and optimize your ad spend with accurate attribution.
Read MoreWhat Is Cross-Channel Attribution? A Complete Guide
Learn how cross-channel attribution works, why it matters for ecommerce, and how to implement it for better marketing decisions.
Read MoreHow to Improve ROAS: 12 Proven Strategies for 2026
Learn actionable strategies to improve your Return on Ad Spend. From fixing attribution to optimizing creatives, boost your ROAS with these proven tactics.
Read MoreWhat Is a Good ROAS? Benchmarks for Ecommerce in 2026
Learn what ROAS benchmarks to target for your ecommerce business. Understand how ROAS varies by industry, channel, and business model.
Read MoreEmail Marketing for Ecommerce: The Complete Guide for 2026
Learn how to build high-converting email marketing campaigns for your ecommerce store. From welcome sequences to abandoned cart flows.
Read More12 Best Cart Abandonment Solutions for Ecommerce in 2026
Discover proven solutions to reduce cart abandonment and recover lost sales. From email flows to exit-intent popups.
Read MoreHow to Increase Customer Lifetime Value: 10 Strategies
Learn proven strategies to increase customer lifetime value (LTV) for your ecommerce business. Boost retention, AOV, and purchase frequency.
Read MoreHow to Increase Shopify Sales: 15 Proven Tactics
Learn actionable strategies to increase sales on your Shopify store. From conversion optimization to marketing tactics.
Read MoreHow to Reduce Customer Acquisition Cost: 8 Strategies
Learn proven strategies to reduce your customer acquisition cost (CAC) while maintaining customer quality.
Read More8 Best Amazon Seller Analytics Tools in 2026
Compare the best analytics tools for Amazon sellers. Track sales, profits, PPC performance, and inventory across your Amazon business.
Read MoreShopify Conversion Rate Optimization: Complete Guide
Learn how to optimize your Shopify store conversion rate. From product pages to checkout, increase the percentage of visitors who buy.
Read MoreIs Dropshipping Still Profitable in 2026? An Honest Analysis
Honest analysis of dropshipping profitability in 2026. Learn the real margins, challenges, and whether it's worth starting.
Read MoreDropshipping Profit Margins: What to Expect in 2026
Understand realistic dropshipping profit margins. Learn how to calculate margins and improve profitability for your store.
Read MoreDropshipping vs Amazon FBA: Which Is Right for You?
Compare dropshipping and Amazon FBA business models. Understand the pros, cons, and which fits your goals.
Read MoreAmazon FBA Profit Calculator: How to Calculate Your Margins
Learn how to calculate Amazon FBA profits and margins. Understand all fees and costs to price products profitably.
Read MoreAmazon FBA vs Shopify: Complete Comparison for 2026
Compare selling on Amazon FBA versus running a Shopify store. Understand which platform fits your business goals.
Read MoreGoogle Ads Conversion Tracking for Shopify: Setup Guide
Step-by-step guide to set up Google Ads conversion tracking on your Shopify store. Track purchases, add to carts, and more.
Read MoreHow to Scale an Ecommerce Business: Strategic Guide
Learn how to scale your ecommerce business sustainably. From operations to marketing, build systems for growth.
Read MoreGoogle Analytics 4 for Ecommerce: Complete Setup Guide
Set up Google Analytics 4 for your ecommerce store. Track purchases, user behavior, and marketing performance.
Read MoreAbandoned Cart Email Strategy: Recover Lost Sales
Build an effective abandoned cart email strategy. Learn timing, copy, and design to recover more lost sales.
Read MoreHow to Reduce Cart Abandonment Rate: 10 Tactics
Learn how to reduce cart abandonment with proven tactics. Fix the issues that cause shoppers to leave without buying.
Read MoreCart Abandonment Bots: Why They Happen and How to Stop Them
Learn why bots are flooding your Shopify store with fake cart abandonments and the proven solutions to stop them.
Read MoreBest WMS for Ecommerce: Top Warehouse Management Systems in 2026
Compare the best warehouse management systems for scaling ecommerce brands. From 50 orders to 500+ daily.
Read MoreFriendly Fraud: What Ecommerce Sellers Need to Know
Learn why chargebacks are exploding and how to protect your Shopify store from friendly fraud.
Read MorePopup Conversion Optimization: Do Shopify Popups Still Work in 2026?
Data-driven guide to email popups on Shopify. Real conversion rates, best practices, and when to skip popups entirely.
Read MoreThe 24-Hour Rule: Catching Problems Before They Compound
Ecommerce problems compound quickly—a tracking issue becomes wasted ad spend, a stockout becomes lost rankings. This guide covers the 24-hour monitoring approach that catches issues before they become disasters.
Read More3PL Costs Explained: What You're Really Paying For (Beyond the Per-Order Fee)
Your 3PL quoted $3.50 per order. Your actual cost is $6.80. Learn what's really in 3PL pricing—storage, receiving, dimensional weight, peak surcharges—and how to audit your invoices.
Read MoreWhen Your Ads Stop Working: The Complete Diagnosis Playbook
Your ROAS crashed. CPC spiked. Conversions disappeared. This comprehensive playbook provides a systematic framework for diagnosing what went wrong with your ads—and finding the actual root cause, not just symptoms.
Read MoreAI Analytics vs Traditional Dashboards: Why the Shift Is Happening
Dashboards show you charts. AI analytics agents answer your questions. This isn't a minor UX upgrade—it's a fundamentally different way to understand your ecommerce business. Here's why the shift is happening and what it means for D2C operators.
Read MoreWhat If Your Business Briefed You Every Morning? AI-Powered Reporting for Ecommerce
Imagine waking up to a briefing that tells you exactly how your business did yesterday, what's trending, and what needs attention—computed from your actual Shopify, Amazon, and ad data. No dashboards. No spreadsheets. The briefing is already done. Here's how AI-powered morning briefings work.
Read MoreAmazon A-to-Z Claims: The Seller's Complete Defense Guide
Read MoreAmazon Account Health Monitoring Without a VA: The Complete Automated Setup
Account suspensions destroy Amazon businesses. This guide shows how to set up automated monitoring for all Account Health metrics—catching problems before they trigger Amazon's enforcement, without hiring a VA.
Read MoreAmazon Advertising Attribution: Understanding What Your Ads Actually Drive
Read MoreAmazon Agency Alternative: The $200/Month Software Stack That Replaces $8K Agencies
Stop paying $5,000-10,000/month for Amazon agencies. This guide breaks down the exact software stack solo sellers use to manage their own accounts for under $300/month—with better results.
Read MoreAmazon FBA True Profit Calculator: What You're Really Making Per ASIN
Amazon sellers overestimate profit by 20-40%. This guide reveals the hidden fees eating your margins and provides a framework for calculating true profit per ASIN—not the vanity numbers Seller Central shows.
Read MoreAmazon Fee Changes 2026: How to Protect Your Margins
Amazon raises FBA fees every year, squeezing seller margins. This guide breaks down the 2026 fee changes, their impact on different product types, and strategies to maintain profitability despite rising costs.
Read MoreAmazon Return Fraud: Detection and Prevention Playbook for FBA Sellers
Learn how to detect and prevent return fraud on Amazon. Covers wardrobing, empty box scams, switcheroo fraud, and the data patterns that predict serial returners before they cost you.
Read MoreAmazon Seller Analytics: What Seller Central Doesn't Show You
Seller Central reports are basic and delayed. Learn what data you're missing, how to calculate true Amazon profitability, and the cross-platform insights that reveal whether Amazon is actually making you money.
Read MoreAmazon vs Shopify: Which Platform Is Actually More Profitable?
Read MoreThe Difference Between a Bad Day and a Real Problem
Not every performance dip requires action. This guide shows how to distinguish normal variance from real problems—so you don't waste time fixing things that would have resolved themselves.
Read MoreBest AI Analytics Agents for Ecommerce in 2026: 7 Platforms Compared
A ranked comparison of the best AI analytics agents for ecommerce in 2026. Covers Niblin, Graphed, Menza, Basedash, Hex, Julius, and Querio — what each does, pricing, and which fits your store.
Read MoreBest Analytics Tools for Shopify + Amazon Sellers
Selling on both Shopify and Amazon means fragmented data. This guide covers the analytics tools that actually unify both channels—so you can ask questions about your entire business and get answers in seconds.
Read MoreBest Data Agent Platforms in 2026: 8 Tools Compared for Every Use Case
A comprehensive comparison of the best data agent platforms in 2026. Covers commerce-native agents, general-purpose agents, notebook-style agents, and database agents — with pricing, strengths, and ideal use cases.
Read MoreBot Traffic Detection for Ecommerce: Protecting Your Data and Ad Spend
Learn how to detect and block bot traffic that's inflating your sessions, wasting ad spend, and polluting your analytics. Covers identification patterns, protection tools, and the downstream costs most stores miss.
Read MoreCAC vs LTV: How to Know If You're Actually Growing
Revenue is up but profit is down? Customer acquisition costs rising faster than lifetime value? This guide shows how to calculate CAC and LTV correctly—and what the ratio tells you about real business health.
Read MoreChargebacks Are Destroying Your Store: The Complete Prevention Guide for 2026
Learn why chargebacks happen and how to prevent them from killing your ecommerce business. Covers Shopify, Amazon A-to-Z claims, fraud detection, and the upstream data patterns that predict chargebacks before they hit.
Read MoreThe Cost of Checking Multiple Dashboards Daily
You check Shopify, Amazon, GA4, Meta, Google Ads, maybe a spreadsheet. Every day. The time adds up to $15,000-40,000/year in hidden costs. This guide quantifies the damage and shows you the alternative.
Read MoreWhy Your CPC Spiked (And What to Do About It)
CPC jumped 50% overnight? This guide covers the common causes of CPC spikes—from competition changes to Quality Score drops—and specific actions to diagnose and reduce your cost per click.
Read MoreCross-Channel Attribution Explained: What Actually Works
Meta says it drove 100 sales. Google says it drove 80. Your store shows 90 total. Attribution is broken—but there are practical ways to make better decisions anyway. This guide cuts through the noise.
Read MoreHow to Track Cross-Channel Attribution Without Hiring an Analyst
Meta says it drove the sale. Google says it did. Your Shopify orders don't add up. You need cross-channel attribution, but hiring a data analyst costs $80K+. Here's how to get the answers without the hire.
Read MoreDaasity Alternatives: 5 Options for Smaller Teams
Daasity is powerful but expensive and complex. This guide covers 5 alternatives that give you unified ecommerce analytics without the enterprise price tag or data team requirement.
Read MoreComputed, Not Generated: Why Deterministic Analytics Matter for Ecommerce
When AI tells you your profit margin is 23.4%, was that calculated from your actual data or generated by a language model? The difference matters enormously. This guide explains deterministic vs generative analytics and why ecommerce brands need computed answers they can trust.
Read MoreIs Your Discount Strategy Killing Your LTV?
Discounts drive sales today but may be training customers to never pay full price. This guide shows you how to measure the real impact of your discount strategy on lifetime value, repeat rate, and long-term profitability.
Read MoreDo You Actually Need an Ecommerce Analytics Tool? (Honest Answer)
Not every store needs a paid analytics tool. This honest guide helps you decide if you're at the stage where tools add value—or if you're just paying for dashboards you won't use.
Read MoreEcommerce Analytics Tools Compared: The Complete 2026 Guide
An honest comparison of ecommerce analytics tools—Triple Whale, Northbeam, Rockerbox, Niblin, and more. Covers what each does well, where they fall short, and how to choose based on your actual needs.
Read MoreEcommerce Anomaly Detection: Catching Problems Before They Cost You Thousands
Learn how to detect anomalies in your ecommerce data before they become costly problems. Covers sales drops, traffic quality issues, return fraud patterns, and the cross-platform signals that predict disasters.
Read MoreThe 7 Ecommerce Metrics Nobody Tracks (But Should)
Revenue, ROAS, conversion rate — you're tracking the basics. But the metrics that actually predict whether your store will thrive or stall are ones most founders have never heard of. Here are 7 overlooked metrics and why they matter.
Read MoreWhy Facebook and Google Metrics Disagree (And What to Do About It)
Facebook claims 80 conversions. Google claims 60. Your store had 75 orders. Each platform measures differently—this guide explains exactly why and how to make sense of conflicting ad metrics.
Read MoreWhen Free Shipping Is Actually Costing You Money (And What to Do Instead)
Free shipping increases conversion but destroys margin on low-AOV orders. Learn to calculate when free shipping makes sense, when it doesn't, and strategies like thresholds and flat-rate that protect profit.
Read MoreFree vs Paid Analytics: When to Upgrade
Free analytics tools work until they don't. This guide covers exactly when the limitations of free tools start costing you money—and which paid features actually matter for ecommerce.
Read MoreGA4 vs Platform Data: Why Numbers Don't Match
GA4 shows 1,000 sessions and 50 conversions. Shopify shows 1,200 visitors and 75 orders. Which is right? This guide explains why GA4 and platform data never match—and which to trust for what.
Read MoreGoogle Ads Click Fraud: How to Detect and Prevent It
Click fraud drains ad budgets without delivering customers. This guide shows how to detect fraudulent clicks in your Google Ads campaigns, measure the impact, and implement protection strategies.
Read MoreThe Hidden Cost of Too Many Dashboards
Every new tool promises to solve a problem, but together they create a bigger one: dashboard fatigue, wasted time, and decisions made on incomplete data. This guide quantifies the hidden cost and shows you how to consolidate.
Read MoreROAS Looks Great But You're Barely Breaking Even — Here's Why
Your ROAS is 4x or higher, but your bank account tells a different story. This guide exposes the gap between reported ROAS and actual profitability — and shows you what to measure instead.
Read MoreInventory Stockout Prevention: The Data-Driven Approach
Stockouts cost more than lost sales—they kill momentum, hurt rankings, and train customers to shop elsewhere. This guide covers how to predict and prevent stockouts using data, not guesswork.
Read MoreMeta Ads Performance Drop: Is It You or the Platform?
Your Meta ads stopped performing. Before you blame yourself, here's how to tell if it's a platform issue, algorithm change, or something on your end—and exactly what to do in each case.
Read MoreNiblin vs Basedash: Which Data Agent Fits Your Ecommerce Stack? (2026)
Basedash is a general-purpose data agent for technical teams. Niblin is a commerce-native AI agent for ecommerce operators. This comparison shows why vertical specificity matters when you sell online.
Read MoreNiblin vs Graphed: Which AI Data Agent Fits Your Ecommerce Business? (2026)
Graphed is a general-purpose data agent. Niblin is built for ecommerce. This comparison breaks down where each excels—and why commerce-native intelligence matters when you sell online.
Read MoreNiblin vs Hiring a Data Analyst: Which Makes Sense for Your Ecommerce Brand? (2026)
A data analyst costs $80K-$120K/year. Niblin costs $299/month. This comparison breaks down when an AI analytics agent can replace a hire, when it cannot, and the real cost-speed-capability tradeoffs.
Read MoreNiblin vs Menza: Ecommerce AI Agents Compared (2026)
Both Niblin and Menza are ecommerce data agents. But Niblin offers 50+ specialized commerce skills, no feature gating, and transparent pricing. Here is an honest breakdown of both platforms.
Read More5 Signs You've Outgrown Google Analytics for Your Ecommerce Store
GA4 was fine when you launched. But now you're spending hours stitching together reports, second-guessing attribution, and wondering what your data actually means. Here are 5 signs you've outgrown it — and what comes next.
Read MorePayment Processing Fees Eating Your Margins: The True Cost Beyond 2.9%
Your processor advertises 2.9% + $0.30. Your effective rate is 3.8%. Learn what actually affects payment processing costs—card types, chargebacks, reserves, international fees—and how to reduce them.
Read MorePerformance Max Not Performing? Root Cause Analysis
Performance Max campaigns are a black box—great when they work, impossible to debug when they don't. This guide shows how to diagnose PMax problems despite Google's limited transparency.
Read MorePlatform Outages vs. Campaign Problems: How to Tell
When ads stop working, is it you or the platform? This guide shows how to quickly distinguish between Meta/Google issues and actual campaign problems—so you don't waste time fixing things that aren't broken.
Read MoreWhen the Problem Isn't Where You Think It Is
You think it's the ads. It's actually the landing page. You think it's the landing page. It's actually the checkout. This guide shows how to trace problems to their actual source.
Read MoreHow to Replace Your Data Analyst with AI ($299/mo vs $132K/yr)
A junior data analyst costs $90-132K/year. An AI analytics agent costs $299/month. For D2C brands doing $2M-$20M, the agent handles 80-90% of the same questions—faster. This guide breaks down exactly what you can replace, what you can't, and how to make the switch.
Read MoreReturn Costs: The Hidden Profit Killer Most Stores Ignore
A 15% return rate doesn't mean 15% revenue loss—it means 20-25% profit loss. Learn the full cost of returns including reverse logistics, restocking, inventory write-offs, and the original costs you can't recover.
Read MoreScaling Amazon FBA Without a Team: The Complete Automation & Analytics Guide
Learn how to scale your Amazon FBA business from $50K to $500K+/month without hiring a team or paying $8K/month for an agency. Covers automation, analytics, account health, and the software stack that replaces headcount.
Read MoreWhy Shopify Revenue Doesn't Match Your Bank Account
Shopify says you made $50,000 this month but your bank shows $42,000. Where did $8,000 go? This guide breaks down every reason Shopify revenue doesn't match your bank deposits—and how to reconcile them.
Read MoreCreating a Single Source of Truth for Your Ecommerce Data
When different team members cite different numbers from different tools, everyone is "right" and nothing gets decided. This guide shows how to establish a single source of truth for your ecommerce business.
Read MoreSudden Sales Drops: The Complete Diagnosis Checklist for Ecommerce
Your sales dropped overnight and you don't know why. Use this systematic checklist to diagnose the cause—from site issues to traffic quality to inventory problems—and fix it before you lose more revenue.
Read MoreThe Real Cost of Too Many Dashboards (And How to Consolidate)
The average D2C brand at $5M+ revenue pays for 5-7 analytics tools and spends 45-90 minutes daily switching between them. The cost isn't just money—it's missed insights, slow decisions, and conflicting data. Here's how to quantify the damage and consolidate intelligently.
Read MoreTraffic Anomalies That Signal Bigger Problems: The Patterns Most Stores Miss
Learn how to detect traffic anomalies before they crash your conversion rate. Covers source mix shifts, quality decline patterns, and the signals that predict chargebacks, bot attacks, and wasted ad spend.
Read MoreTriple Whale vs Niblin: An Honest Comparison (2026)
Triple Whale is an attribution and analytics dashboard. Niblin is an AI analytics agent with 50+ commerce skills. This honest comparison explains why many teams use both—and which problems each solves better.
Read MoreTrue Cost Per Order Calculator: Know Your Real Ecommerce Numbers
Stop guessing your profit margins. Use this calculator to find your true cost per order including COGS, fulfillment, processing, returns, and overhead. Most stores discover they're 20-40% less profitable than they thought.
Read MoreTrue Ecommerce Profitability: The Costs Your Dashboard Doesn't Show
Your Shopify dashboard shows revenue, but not true profit. Learn to calculate real profitability by accounting for 3PL costs, payment fees, returns, chargebacks, and the hidden costs eating your margins.
Read MoreUnified Ecommerce Analytics: The Complete Guide
Most ecommerce businesses have data everywhere but insights nowhere. This comprehensive guide covers how to unify your analytics across Shopify, Amazon, ad platforms, and more—so you can finally see the complete picture of your business.
Read MoreWhat Is an AI Analytics Agent? (And Why Ecommerce Brands Are Switching)
AI analytics agents are replacing dashboards for ecommerce brands. Instead of clicking through charts, you ask a question and get a computed answer in seconds. This guide explains what they are, how they work, and why they matter for D2C operators.
Read MoreWhy Did My Revenue Drop? A Diagnostic Framework for Ecommerce
Revenue dropped and you can't figure out why. This diagnostic framework walks you through every layer — traffic, conversion, AOV, channel mix, and seasonality — so you can pinpoint the cause in minutes instead of days.
Read MoreShopify Plus Checkout Tracking Is Broken: Here's What Happened and How to Fix It
On August 28, 2025, Shopify disabled checkout.liquid - silently breaking conversion tracking for thousands of Plus stores. Here's how to check if you're affected and what to do.
Read MorePlan, forecast and close with Niblin
Budget, rolling forecast, variance, cash and inventory for consumer brands, on numbers reconciled to your books.