
 By
You present the forecast to leadership: "We will do $5M revenue next year."
Then someone asks: "What if tariffs increase by 15%? What if the economy slows and customer acquisition costs double? What if we expand into Canada?"
If you only have a single forecast, you have no answers. Scenario and sensitivity analysis let you show leadership not just one future, but a range of plausible futures and the probability of each.
Scenario vs Sensitivity Analysis: The Key Difference
The 50-word definitions
Scenario analysis explores how business outcomes change when multiple assumptions change together (e.g., "if we expand to Canada and hiring increases, what happens to profitability?").
Sensitivity analysis isolates one variable and shows how outcomes change across a range of values for that variable (e.g., "what is profit at 5%, 10%, 15% price increases?").
Think of it this way:
- Scenario: "Here are three versions of the future: Base (50% probability), Upside (25%), Downside (25%)."
- Sensitivity: "If this one variable changes, here is how the outcome shifts."
Scenarios are strategic. Sensitivity is diagnostic. You need both.
Scenario Analysis: Building Base, Upside, and Downside Cases
What is a scenario?
A scenario is an internally consistent view of the future. It has a probability (usually implicit) and a set of coordinated assumptions. The three most common are Base, Upside, and Downside.
Base case
The most likely outcome. This is your forecast. It assumes trends continue, no major shocks, and execution roughly as planned.
- Revenue growth: historical trend (e.g., 15% YoY)
- Margins: stable or slight improvement (efficiency gains offset cost pressure)
- Headcount: planned hiring, no accelerations
- CapEx: ongoing maintenance and planned investments
- Probability: often treated as the most likely case
Upside case
A better-than-expected outcome. Execution exceeds expectations, market conditions are favorable, or a major initiative succeeds.
Upside assumptions are coordinated. If revenue grows faster, COGS should not grow at the same rate (economies of scale). If a new channel succeeds, you may need more headcount. Upside is not just "multiply everything by 1.2x."
- Revenue growth: 25% YoY (vs. 15% base) due to successful product launch
- Gross margin: expands to 62% (vs. 60% base) due to manufacturing efficiency
- Operating expenses: 20% of revenue (vs. 23% base) due to scale
- Headcount growth: 20% (vs. 15% base) to support growth
- Probability: lower than base; say how likely you think it is
Downside case
A worse-than-expected outcome. Market slowdown, competitive pressure, execution challenges, or an external shock (recession, supply chain disruption, tariffs).
- Revenue growth: 5% YoY (vs. 15% base) due to macro slowdown
- Gross margin: contracts to 55% (vs. 60% base) due to price pressure
- Operating expenses: 28% of revenue (vs. 23% base) fixed costs do not flex down
- Headcount growth: frozen
- Probability: lower than base; say how likely you think it is
Building scenarios in practice
Keep one model and add a scenario selector: an assumptions block with a column per scenario and a single switch cell (1 = base, 2 = upside, 3 = downside) that the model reads through CHOOSE or INDEX. Copying the model three times guarantees the copies drift apart. Change the 3-5 drivers that matter in each scenario and leave the rest identical, so you can see what moved the result.
| Assumption | Base Case | Upside | Downside |
|---|---|---|---|
| Revenue growth | 15% | 25% | 5% |
| Gross margin | 60% | 62% | 55% |
| OpEx as % of revenue | 23% | 20% | 28% |
| Headcount growth | 15% | 20% | 0% |
| CapEx | $500K | $750K | $200K |
Run each scenario through your model and see the outcomes: net income, cash flow, balance sheet changes. Show leadership the P&L and cash flow for each.
Sensitivity Analysis: Building Data Tables
What is a sensitivity table?
A sensitivity table (also called a data table) shows how a single output (usually net income or cash flow) changes when one or two input variables change. It is a grid: rows are one variable, columns are another.
One-way sensitivity (single variable)
Example: How does net income change when revenue growth varies from 5% to 25%?
| Revenue Growth | 5% | 10% | 15% | 20% | 25% |
|---|---|---|---|---|---|
| Net Income | $200K | $350K | $500K | $650K | $800K |
This is simple but limited. It only shows the impact of one variable at a time.
Two-way sensitivity (two variables)
Example: How does net income change when both revenue growth and gross margin vary?
| Revenue Growth / Gross Margin | 55% | 57.5% | 60% | 62.5% | 65% |
|---|---|---|---|---|---|
| 5% | $150K | $200K | $250K | $300K | $350K |
| 10% | $300K | $375K | $450K | $525K | $600K |
| 15% | $450K | $550K | $650K | $750K | $850K |
| 20% | $600K | $725K | $850K | $975K | $1,100K |
| 25% | $750K | $900K | $1,050K | $1,200K | $1,350K |
Two-way tables are more useful because they show interactions. "If growth is 5%, margin matters more. If growth is 25%, margin matters less because revenue scale dominates the math."
How to build a data table in Excel
- 1. Set up your model with assumptions clearly labeled.
- 2. Create a new sheet for the sensitivity table.
- 3. Create the table structure: rows are one variable, columns are another.
- 4. Use Excel Data Table feature (Data > What-If Analysis > Data Table) to calculate all combinations at once.
- 5. Or: use formulas. Each cell in the table references your model with the row and column inputs substituted.
Mistake to avoid: make sure the inputs in your sensitivity table axes are hard-coded values, not linked back to the assumptions sheet. If they are linked, changing one cell might ripple through the table and confuse the output.
When to use sensitivity vs. scenario
- Use sensitivity to show risk: "If price increases 5%, profit is X. If it increases 10%, profit is Y. Here is where we are vulnerable."
- Use scenarios to show strategy: "If we successfully execute the product roadmap, we hit the upside. If market conditions slow, we hit the downside. Here is how we prepare for each."
Executives usually want scenarios for strategic decisions (board updates, budget approval) and sensitivity for risk management (what if tariffs, what if churn).
Building a Complete Scenario and Sensitivity Model
Step 1: Start with your base forecast
Build your core financial model (income statement, balance sheet, cash flow). This is the base case.
Step 2: Identify 3-5 key drivers of uncertainty
What assumptions, if wrong, would most impact the outcome?
- Revenue growth rate
- Customer acquisition cost (CAC) or marketing efficiency
- Gross margin or cost of goods
- Operating expense level
- Headcount scaling
Prioritize: which 2-3 drive the most impact? Build sensitivity tables for those.
Step 3: Build three scenarios (Base, Upside, Downside)
- Copy your base model three times.
- Adjust the 3-5 key drivers for each scenario.
- Ensure assumptions are internally consistent ("if growth is 25%, headcount should grow; if growth is 5%, headcount should be flat").
- Run the models and capture outputs: revenue, gross margin, net income, operating cash flow, ending cash.
Step 4: Build sensitivity tables for the top 2 drivers
- Create a two-way sensitivity table: rows are one variable (e.g., revenue growth), columns are another (e.g., gross margin).
- Output: net income or cash flow.
- This shows: "If both variables move, here is the range of outcomes."
Step 5: Create a summary dashboard
- Show the three scenarios side by side: revenue, gross margin, operating income, net income, operating cash flow, ending cash.
- Show the sensitivity table below.
- Label which scenario is base, upside, and downside.
- Label the probability of each scenario.
This dashboard is what you show leadership. It tells the story: "Here is where we probably end up (base), here is what success looks like (upside), here is what we need to prepare for (downside), and here is how sensitive the outcome is to key risks (sensitivity table)."
Worked Example: Scenarios and a Sensitivity Table for a Consumer Brand
Illustrative example: BeautyBox sells DTC on Shopify, on Amazon and through wholesale. Every figure below is an example assumption ($M unless noted), chosen so you can follow the arithmetic. Swap in your own numbers.
Base case assumptions
- Revenue: DTC $2.50, Amazon $1.75, wholesale $0.75 (total $5.00)
- DTC gross margin after COGS, shipping and payment fees: 70%
- Amazon product margin before Amazon fees: 60%. Amazon take rate (referral plus FBA fees as a share of Amazon revenue): 28%, so Amazon margin is 32%
- Wholesale gross margin after trade discounts and freight: 45%
- DTC acquisition: 20,000 new customers at a $40 CAC = $0.80 of paid media
- Amazon advertising: 10% of Amazon revenue
- Fixed operating expenses: $1.20
Base case operating profit
| Line | Calculation | $M |
|---|---|---|
| DTC gross profit | $2.50 x 70% | $1.750 |
| Amazon gross profit | $1.75 x (60% - 28%) | $0.560 |
| Wholesale gross profit | $0.75 x 45% | $0.338 |
| Total gross profit | 52.9% of revenue | $2.648 |
| DTC paid media | 20,000 x $40 | ($0.800) |
| Amazon advertising | $1.75 x 10% | ($0.175) |
| Fixed operating expenses | ($1.200) | |
| Operating profit | $0.473 |
Three scenarios built from the same drivers
| Driver or result | Downside | Base | Upside |
|---|---|---|---|
| DTC / Amazon / wholesale revenue | $2.20 / $1.60 / $0.60 | $2.50 / $1.75 / $0.75 | $3.00 / $2.10 / $0.90 |
| Amazon take rate | 31% | 28% | 27% |
| New DTC customers x CAC | 18,000 x $48 | 20,000 x $40 | 22,000 x $36 |
| Fixed operating expenses | $1.15 | $1.20 | $1.30 |
| Total revenue | $4.40 | $5.00 | $6.00 |
| Gross margin | 51.7% | 52.9% | 53.3% |
| Paid media + Amazon ads | $1.02 | $0.98 | $1.00 |
| Operating profit | $0.10 | $0.47 | $0.90 |
Each scenario changes the drivers together, because in real life they move together: a downturn raises CAC, pushes volume to Amazon and squeezes wholesale at the same time. The downside still makes money, but only $0.10M, which tells leadership how little room there is before cuts are needed.
Two-variable sensitivity: operating profit ($K) by Amazon take rate and DTC CAC
Everything else is held at the base case. Each cell = base operating profit - (take rate - 28%) x $1.75M Amazon revenue - (CAC - $40) x 20,000 customers.
| Amazon take rate / DTC CAC | $30 | $35 | $40 | $45 | $50 |
|---|---|---|---|---|---|
| 24% | $742 | $642 | $542 | $442 | $342 |
| 26% | $707 | $607 | $507 | $407 | $307 |
| 28% (base) | $673 | $572 | $472 | $373 | $272 |
| 30% | $638 | $537 | $437 | $337 | $237 |
| 32% | $602 | $502 | $402 | $302 | $202 |
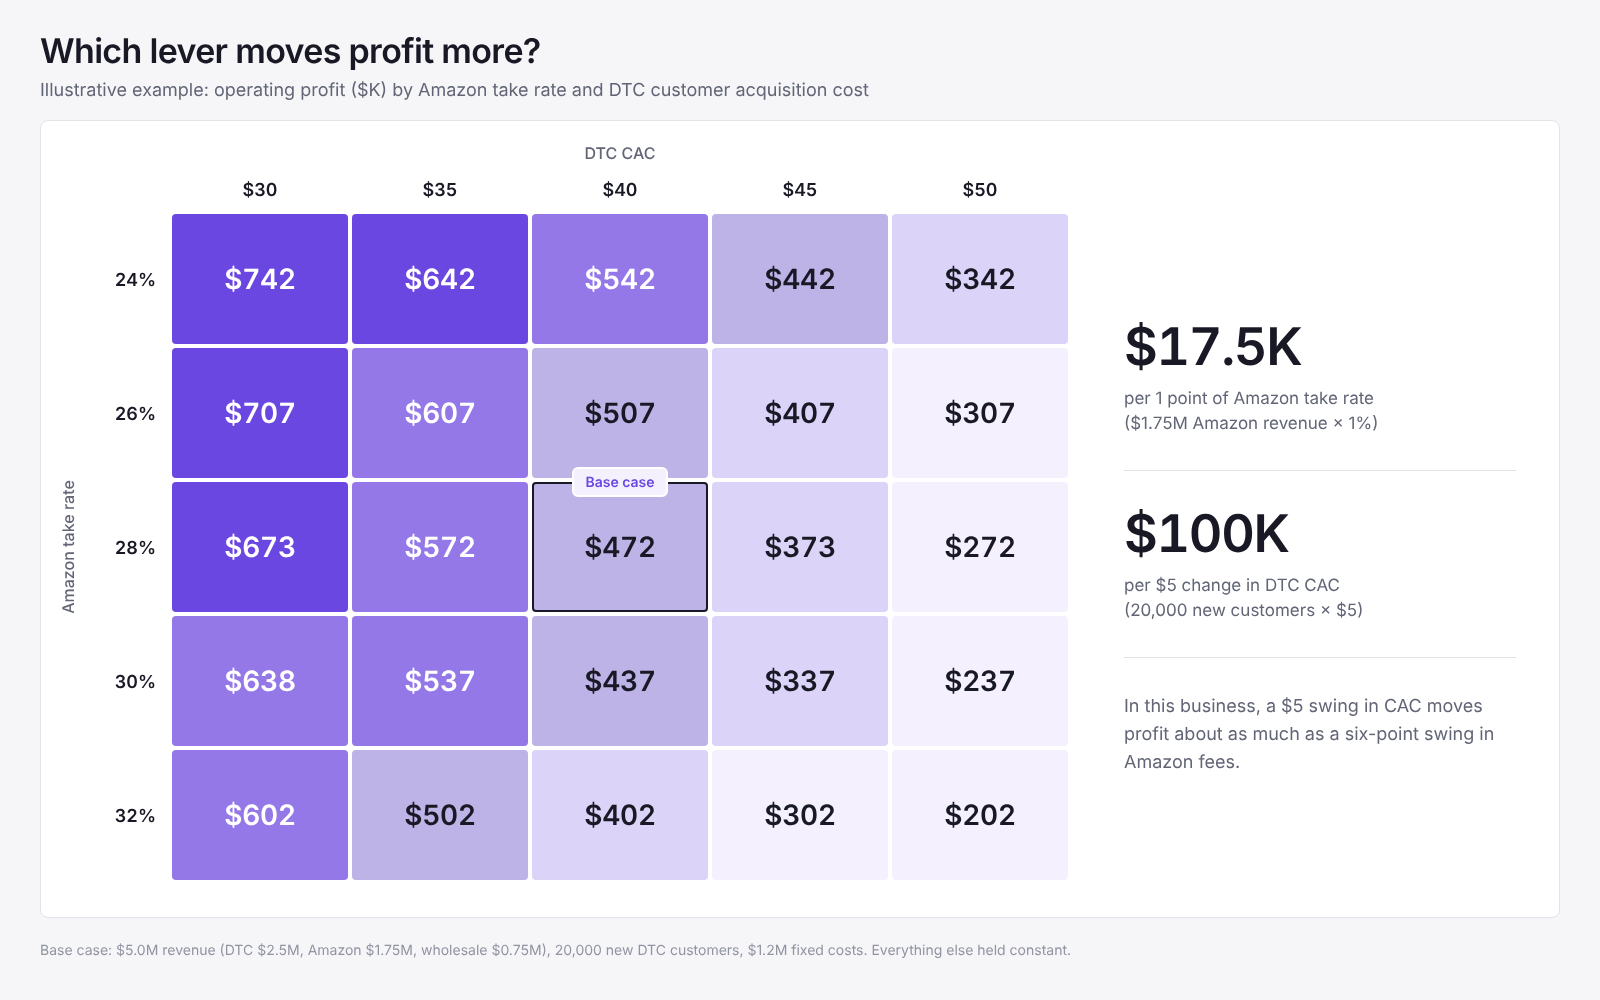
How to read it: one point of Amazon take rate is worth $17.5K of operating profit ($1.75M x 1%). A $5 change in DTC CAC is worth $100K (20,000 customers x $5). So in this business, a $5 swing in CAC moves profit about as much as a six-point swing in Amazon fees. That tells the team where to spend its time: acquisition efficiency first, fee negotiation second. Your own table may say the opposite, which is exactly why you build it.
Excel tip: build this with Data > What-If Analysis > Data Table, with the take rate as the row input cell and CAC as the column input cell, both pointing at the same operating profit formula. Never hard-code the grid.
Communicating Results to Leadership
Show probabilities, not just ranges
Do not just say "Net income will be between $0 and $2.25M." That is too wide. Say: "We expect $0M (50% probability). There is upside to $2.25M (25%) if the new product succeeds. There is downside to a loss if the macro slows (25%)."
This frames the risk appropriately.
Use a single chart to show all three scenarios
Create a waterfall or grouped bar chart showing revenue, gross margin, operating expenses, and net income for each scenario. Executives can see the story in one visual: "If growth lands, here is the profit pool. If it is 70/30 split between gross margin and OpEx, here is what changes in upside vs. downside."
Label which drivers matter most (sensitivity insights)
Call out: "Gross margin is the highest-sensitivity item. A 2% shift in COGS changes net income by $X." This helps leadership prioritize what to manage.
Tie scenarios to strategic decisions
Say: "The upside case assumes we successfully launch in Canada. The downside case assumes the macro slows and CAC rises. Here is what we are betting on. Here is what we are protecting against."
This connects the financial model to strategy, not just numbers.
For Consumer Brands: Scenario Planning for Tariffs and Channel Mix
Consumer brands face unique scenario risks: tariffs, channel mix shifts, seasonality volatility, and supply chain shocks. A three-scenario model should address these.
Add a fourth scenario: tariff shock
In addition to base/upside/downside, build a tariff scenario. "What if tariffs on imports increase from 0% to 25% on our primary suppliers?"
- COGS increases 5-8% (passed-through cost of tariff)
- Gross margin declines by 3-5 percentage points
- Price increases are delayed or limited (customer acceptance)
- Volume may decline if prices rise (elasticity)
- Cash requirement increases (need to pre-buy inventory before tariff takes effect)
See tariff-scenario-planning for the full tariff analysis.
Sensitivity: gross margin and channel mix
Build a two-way sensitivity showing how net income changes when: 1) gross margin shifts, and 2) channel mix shifts (% of revenue from DTC vs. Amazon vs. wholesale).
| DTC % / Gross Margin | 55% | 60% | 65% | 70% |
|---|---|---|---|---|
| 40% DTC / 60% Amazon+WL | $800K | $1.0M | $1.2M | $1.4M |
| 50% DTC / 50% Amazon+WL | $1.0M | $1.3M | $1.6M | $1.9M |
| 60% DTC / 40% Amazon+WL | $1.2M | $1.6M | $2.0M | $2.4M |
| 70% DTC / 30% Amazon+WL | $1.4M | $1.9M | $2.4M | $2.9M |
This shows: "Expanding DTC is worth $200-300K in net income. But if gross margin falls (tariffs or price pressure), DTC upside shrinks."
This is the level of detail Niblin provides for consumer brands: scenario and sensitivity analysis at the SKU, channel, and seasonal level, not just at the aggregate. When you model tariffs, it automatically recalculates working capital, cash flow, and balance sheet impact across all channels.
FAQ: Scenario and Sensitivity Analysis
Q: How many scenarios should I build?
Three (base, upside, downside) is the standard and usually enough. More than five becomes confusing. If you need to explore more than five outcomes, use sensitivity analysis instead: show how a single metric changes across a range.
Q: Should I always use the same probabilities (50/25/25)?
No, use probabilities that reflect reality. If you are in a mature, stable business, base case might be 70%, upside 20%, downside 10%. If you are early stage or facing major uncertainty, spread them more evenly. The probabilities should reflect your confidence.
Q: Can I use a sensitivity table with more than two variables?
You can, but it becomes hard to visualize. A three-way table is usually unreadable. For 3+ variables, either build separate two-way tables for each pair, or use a scenario to show all variables changing together.
Q: How often should I update scenarios?
Update scenarios quarterly (after you close actual results and reset forecasts) or when assumptions materially change (new competitive threat, tariff announcement, macro shock). Do not update monthly; scenarios are strategic, not operational.
Q: Is sensitivity analysis a substitute for Monte Carlo simulation?
No. Sensitivity shows discrete outcomes across a range. Monte Carlo simulates thousands of random outcomes based on probability distributions. For most FP&A use cases, sensitivity and scenario analysis are simpler and more useful. Monte Carlo is overkill for corporate finance decision-making; executives would rather see "P50 = $2M, P10 = $1M, P90 = $3M" than a distribution chart.
Building scenario and sensitivity models for consumer brands requires analyzing tariffs, seasonality, and channel mix across hundreds of SKUs. See how Niblin automates scenario modeling so you can model tariff-scenario-planning and channel economics without rebuilding the model. Get started